Home | Category: Physical Oceanography
SATELLITES AND REMOTE SENSING USED TO OBSERVE THE OCEAN

Oa-buoy, which measures temperatures in the sea Satellites are amazing tools for observing the ocean. They can "see the sea" in ways that are otherwise impossible. By remotely sensing from their orbits high above the Earth, satellites provide us much more information than would be possible to obtain solely from the surface. [Source: NOAA]
Remote sensing is the science of obtaining information about objects or areas from a distance, typically from aircraft or satellites. Remote sensors collect data by detecting the energy that is reflected from Earth. These sensors can be on satellites or mounted on aircraft. Remote sensors can be either passive or active. Passive sensors respond to external stimuli. They record natural energy that is reflected or emitted from the Earth's surface. The most common source of radiation detected by passive sensors is reflected sunlight. In contrast, active sensors use internal stimuli to collect data about Earth. For example, a laser-beam remote sensing system projects a laser onto the surface of Earth and measures the time that it takes for the laser to reflect back to its sensor.
Using satellites, researchers closely study the ocean. Information gathered by satellites can tell us about ocean bathymetry, sea surface temperature, ocean color, coral reefs, and sea and lake ice. Scientists also use data collection systems on satellites to relay signals from transmitters on the ground to researchers in the field — used in applications such as measuring tidal heights and the migration of whales. Transmitters on satellites also relay position information from emergency beacons to help save lives when people are in distress on boats, airplanes, or in remote areas. Here are just a few of the many ways satellites help us learn more about our ocean:
Remote sensing has a wide range of applications in many different fields: 1) Coastal applications: Monitor shoreline changes, track sediment transport, and map coastal features. Data can be used for coastal mapping and erosion prevention. 2) Ocean applications: Monitor ocean circulation and current systems, measure ocean temperature and wave heights, and track sea ice. Data can be used to better understand the oceans and how to best manage ocean resources. Hazard assessment: Track hurricanes, earthquakes, erosion, and flooding. Data can be used to assess the impacts of a natural disaster and create preparedness strategies to be used before and after a hazardous event. 3) Natural resource management: Monitor land use, map wetlands, and chart wildlife habitats. Data can be used to minimize the damage that urban growth has on the environment and help decide how to best protect natural resources.
Related Articles:
UNDERWATER EXPLORATION: TECHNOLOGY, VEHICLES, SHIPS ioa.factsanddetails.com ;
OCEANOGRAPHY AND STUDYING THE SEA ioa.factsanddetails.com ;
STUDYING OCEAN LIFE: TAGGING, TELEMETRY, CENSUSES AND TOPP ioa.factsanddetails.com ;
CHEMISTRY OF THE OCEAN: SALT, OXYGEN AND CARBON ioa.factsanddetails.com
PHYSICS OF THE OCEAN: PRESSURE, SOUND AND LIGHT ioa.factsanddetails.com
TEMPERATURE IN THE OCEAN ioa.factsanddetails.com
PHYSICAL FEATURES OF THE OCEAN FLOOR: TRENCHES, VENTS, MOUNTAINS ioa.factsanddetails.com
SEAMOUNTS AND VOLCANOES IN THE OCEAN ioa.factsanddetails.com
WAVES IN THE OCEAN: TYPES, CAUSES, AND EFFORTS TO DESCRIBE, PREDICT AND MEASURE THEM ioa.factsanddetails.com
LARGE WAVES: ROUGE WAVES, METEOTSUNAMIS AND THE BIGGEST WAVES EVER ioa.factsanddetails.com
OCEAN CURRENTS: FORCES, CONCEPTS, TYPES, MAPS ioa.factsanddetails.com
OCEAN TIDES: TYPES, TERMS, FORCES, MEASUREMENTS AND PREDICTIONS ioa.factsanddetails.com
OCEANS, WINDS AND WEATHER ioa.factsanddetails.com
MODELS IN OCEANOGRAPHY ioa.factsanddetails.com
Websites and Resources: National Oceanic and Atmospheric Administration (NOAA) noaa.gov; “Introduction to Physical Oceanography” by Robert Stewart , Texas A&M University, 2008 uv.es/hegigui/Kasper ; Woods Hole Oceanographic Institute whoi.edu ; Cousteau Society cousteau.org ; Monterey Bay Aquarium montereybayaquarium.org
RECOMMENDED BOOKS:
“The Blue Machine: How the Ocean Works” by Helen Czerski, explains how the ocean influences our world and how it functions. Amazon.com
“How the Ocean Works: An Introduction to Oceanography” by Mark Denny (2008) Amazon.com
“The Science of the Ocean: The Secrets of the Seas Revealed” by DK (2020) Amazon.com
“Atmospheric and Oceanic Fluid Dynamics: Fundamentals and Large-Scale Circulation” by Geoffrey K. Vallis (2006) Amazon.com
“Soundings: The Story of the Remarkable Woman Who Mapped the Ocean Floor” by Hali Felt (2012) Amazon.com
“Descriptive Physical Oceanography” by Lynne Talley (2017) Amazon.com
“Essentials of Oceanography” by Alam Trujillo and Harold Thurman Amazon.com
“The Unnatural History of the Sea” by Callum Roberts (Island Press (2009). Roberts is a professor of marine conservation at the University of York in England Amazon.com
“Ocean: The World's Last Wilderness Revealed” by Robert Dinwiddie , Philip Eales, et al. (2008) Amazon.com
“Into the Great Wide Ocean: Life in the Least Known Habitat on Earth” by Sönke Johnsen (2024) Amazon.com
“An Introduction to the World's Oceans” by Keith A. Sverdrup (1984) Amazon.com
“The Sea Around Us” by Rachel Carson, an influential work that highlights the importance of ocean conservation (1950) Amazon.com
“The Life & Love of the Sea” by Lewis Blackwell Amazon.com
“Song for the Blue Ocean” by Carl Safina (1998) Amazon.com
“Blue Hope: Exploring and Caring for Earth's Magnificent Ocean” by Sylvia Earle (2014) Amazon.com
“National Geographic Ocean: A Global Odyssey” by Sylvia Earle (2021) Amazon.com
“The Ocean Book: The Stories, Science, and History of Oceans” by DK (2025) Amazon.com
Things Observed in the Ocean with Satellites
Sea Surface Temperatures: Knowing the temperature of the sea surface can tell scientists a lot about what's happening in and around the ocean. Temperature changes influence the behavior of fish, can cause the bleaching of corals, and affect weather along the coast. Satellite images of sea surface temperature also show patterns of water circulation. Examples include locations of upwelling, characterized by cold waters that rise up from the depths, often near the coasts; and warm water currents, such as the Gulf Stream. The most commonly used instrument to collect sea surface temperatures is the Visible Infrared Imaging Radiometer Suite (VIIRS) instrument aboard the NOAA/NASA Suomi NPP satellite. This sensor captures new data every day, allowing scientists to piece together series of maps that show sea surface temperature variations over time for different regions around the globe. [Source: NOAA]
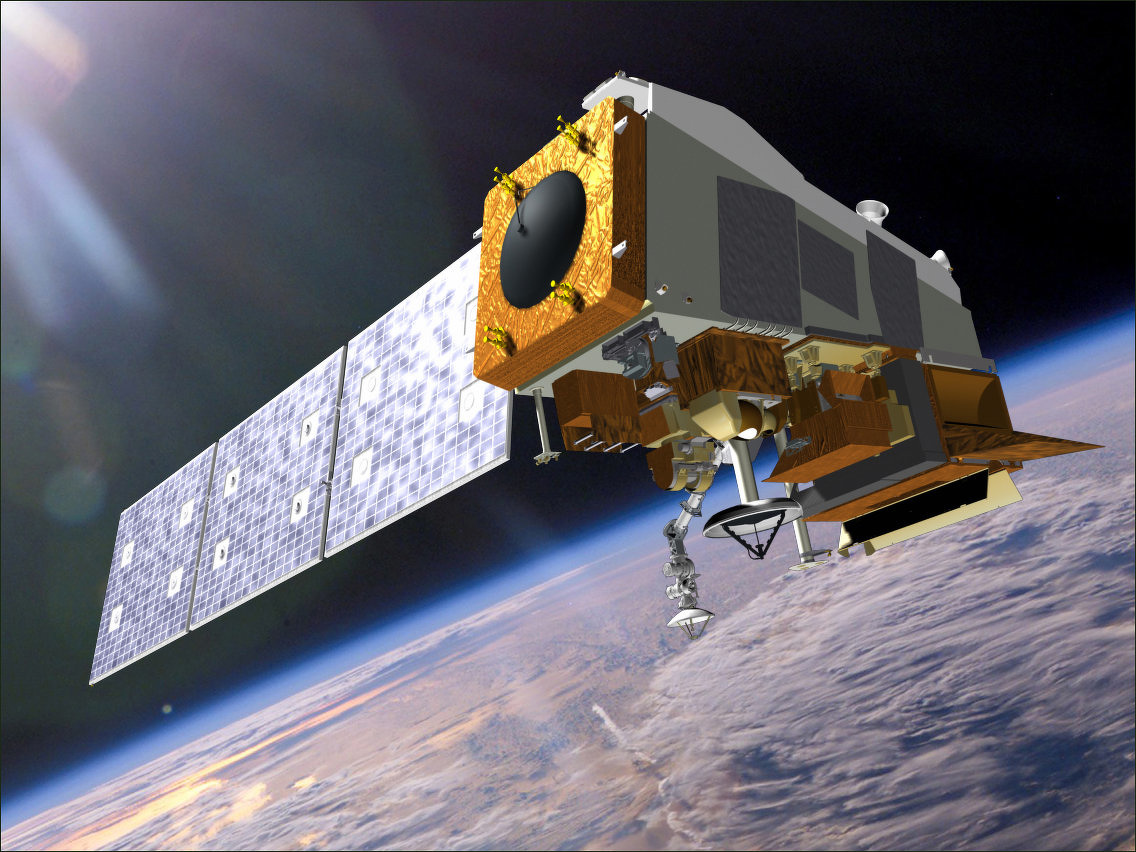
NOAA/NASA Suomi NPP satellite
Sea Surface Color: Satellites also provide information about the color of the ocean. For example, color data helps researchers determine the impact of floods along the coast, detect river plumes, and locate blooms of harmful algae that can contaminate shellfish and kill other fish and marine mammals. Ocean color data from satellites allows us not only to identify where an algal bloom is forming, but also to predict where it might drift in the future. Treatment plants also use algal bloom forecasts created by NOAA to decide when to change their water treatment formula to handle the algae.
Sea Level Change: One of the most significant potential impacts of climate change is sea level rise, which can cause inundation of coastal areas and islands, shoreline erosion, and destruction of important ecosystems such as wetlands and mangroves. Satellite altimeter radar measurements can be combined with precisely known spacecraft orbits to measure sea level on a global basis with unprecedented accuracy. The measurement of long-term changes in global mean sea level provides a way to test climate models' predictions of global warming.
Mapping: The surface of the ocean bulges outward and inward, mimicking the topography of the ocean floor. The bumps, too small to be seen, can be measured by a radar altimeter aboard a satellite. Satellite imagery may also be used to map features in the water, such as coral reefs. Sea floor geology is far simpler than the geology of the continents because erosion rates are lower, and also because the continents have suffered multiple collisions associated with the opening and closing of ocean basins. Despite its relative youth and geologic simplicity, most of this deep seafloor has remained poorly understood because it is masked by the ocean. To date, ships have charted only a small fraction of the seafloor. But thanks to gravity, the ocean surface has broad bumps and dips that mimic the topography of the ocean floor. These bumps and dips can be mapped using a very accurate radar altimeter mounted on a satellite.
Weather: The ocean plays a major role in regulating the planet's weather and climate. Weather data is perhaps the most well known application of satellite technology. NOAA's operational weather satellite system is composed of two types of satellites: geostationary operational environmental satellites (GOES) for short-range forecasts, warnings, and observations; and polar-orbiting satellites for longer-term forecasting. Both types of satellite are necessary to provide a complete global weather-monitoring system.
Tracking: Satellites providing environmental imagery may also be used jointly with other organizations that receive data from various sensors. For example, marine animals, such as sea turtles and manatees, can be fitted with transmitters that relay information about their locations to orbiting satellites. Similar technology is also used for human search and rescue.
Measuring Sea Surface Temperatures and Water Levels
Because the ocean covers 71 percent of Earth's surface, scientists record sea surface temperature (SST) to understand how the ocean communicates with Earth's atmosphere. SST provides fundamental information on the global climate system. SST is an essential parameter in weather prediction and atmospheric model simulations, and is also important for the study of marine ecosystems. SST data are especially useful for identifying the onset of El Niño and La Niña cycles. During El Niño, temperatures in the Pacific near the equator are warmer than normal. During La Niña, the same area experiences colder than normal ocean temperatures. These cycles are caused by multiyear shifts in pressure and wind speeds, and affect ocean circulation, global weather patterns, and marine ecosystems. [Source: NOAA]
SST measurements benefit a wide spectrum of operational applications, including climate and seasonal monitoring/forecasting, military defense operations, validation of atmospheric models, sea turtle tracking, evaluation of coral bleaching, tourism, and commercial fisheries management. To measure SST, scientists deploy temperature sensors on satellites, buoys, ships, ocean reference stations, and through marine telemetry. The NOAA-led U.S. Integrated Ocean Observing System (IOOS®) and NOAA's Center for Satellite Applications and Research (STAR) merge their data to provide SSTs worldwide.
The National Water Level Observation Network (NWLON) is a permanent observing system that includes 210 continuously operating water level stations throughout the U.S. and its territories. Accurate water level data is critical for many coastal activities, from navigation and engineering to restoration and preservation. In addition to water levels, the stations measure other oceanographic and meteorological parameters such as water temperature and wind speed. NOAA uses this information to ensure safe navigation through access to real-time data 24 hours a day, seven days a week. NOAA nowcast and forecast models use the data to provide a look into present and future oceanographic conditions, which can enhance tsunami and storm surge warnings. NOAA also uses this data to publish annual tide predictions.
NWLON is managed by NOAA’s Center for Operational Oceanographic Products and Services. NWLON provides historical as well as present-day water level information. Historical data is used to compute relative local mean sea level trends and to understand the patterns of high tide events. The first water level observing stations were established in the 1850s, and some have been collecting data ever since!
Hydrophones
A hydrophone is an underwater device that detects and records ocean sounds from all directions. People often think that the underwater world is silent. In fact, numerous marine organisms use sound for communication, reproduction, and to seek prey. Sounds are also important to scientists studying certain aspects of the ocean and navies tracking ships are particularly submarines. [Source: NOAA]
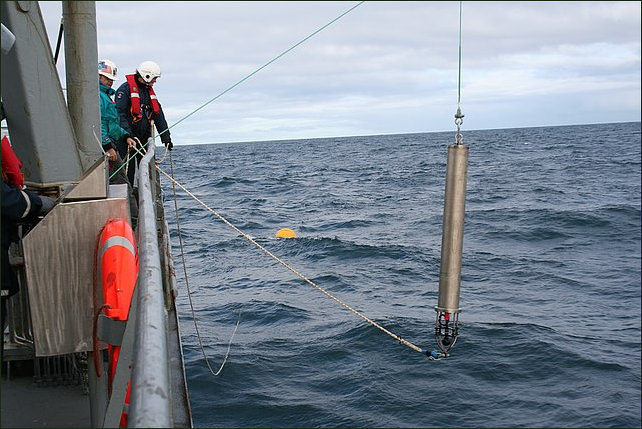
Lowering a hydrophone into the Atlantic
Just as a microphone collects sound in the air, a hydrophone detects acoustic signals under the water. Most hydrophones are based on a special property of certain ceramics that produces a small electrical current when subjected to changes in underwater pressure. When submerged in the ocean, a ceramic hydrophone produces small-voltage signals over a wide range of frequencies as it is exposed to underwater sounds emanating from any direction.
By amplifying and recording these electrical signals, hydrophones measure ocean sounds with great precision. While a single hydrophone can record sounds from any direction, several hydrophones simultaneously positioned in an array, often thousands of miles apart, result in signals that can be manipulated to “listen” with greater sensitivity than a single device. Omni-directional and hemi-directional hydrophones pick up sound from a particular direction and can be used to track fish movements.
NOAA’s Pacific Marine Environmental Laboratory (PMEL) also frequently uses hydrophones. PMEL acquires long-term data sets of the global ocean acoustics environment to identify and assess acoustic impacts from both human activities and natural processes, such as underwater volcanoes, earthquakes, and icequakes on the marine environment.
Echo Sounders and Measuring Ocean Depth
Robert Stewart wrote in the “Introduction to Physical Oceanography”: The depth of the ocean is usually measured two ways: 1) using acoustic echo-sounders on ships, or 2) using data from satellite altimeters. [Source: Robert Stewart, “Introduction to Physical Oceanography”, Texas A&M University, 2008]
Most maps of the ocean are based on measurements made by echo sounders. The instrument transmits a burst of 10–30 kHz sound and listens for the echo from the sea floor. The time interval between transmission of the pulse and reception of the echo, when multiplied by the velocity of sound, gives twice the depth of the ocean.
The first transatlantic echo soundings were made by the U.S. Navy Destroyer Stewart in 1922. This was quickly followed by the first systematic survey of an ocean basin, made by the German research and survey ship Meteor during its expedition to the south Atlantic from 1925 to 1927. Since then, oceanographic and naval ships have operated echo sounders almost continuously while at sea.
Millions of kilometers of ship-track data recorded on paper have been digitized to produce data bases used to make maps. The tracks are not well distributed. Tracks tend to be far apart in the southern hemisphere, even near Australia and closer together in well mapped areas such as the North Atlantic. Echo sounders make the most accurate measurements of ocean depth. Their accuracy is ±1 percent. [Source: Robert Stewart, “Introduction to Physical Oceanography”, Texas A&M University, 2008]
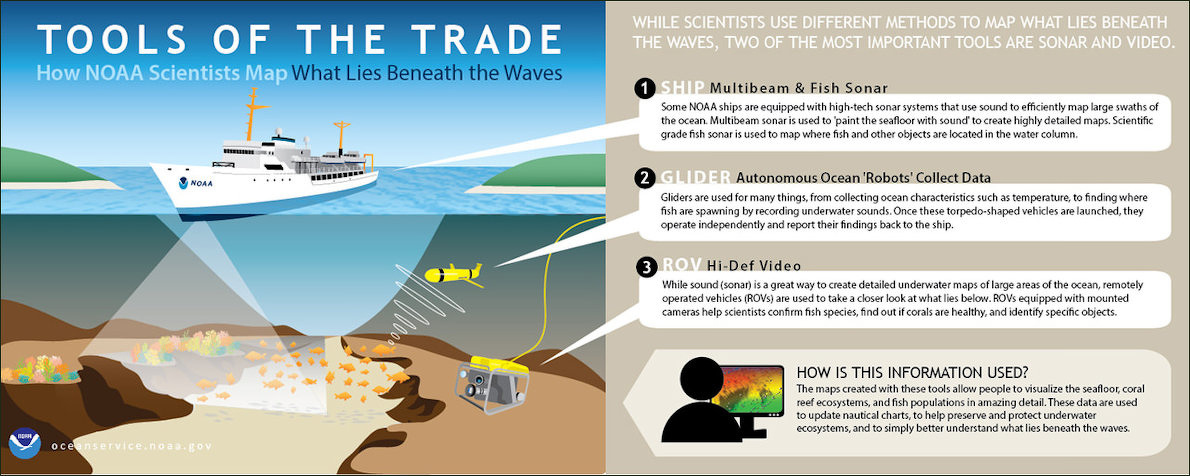
Sonar and Backscatter
Sonar uses sound waves to 'see' in the water. Sonar, short for Sound Navigation and Ranging, is helpful for exploring and mapping the ocean because sound waves travel farther in the water than do radar and light waves. NOAA scientists primarily use sonar to develop nautical charts, locate underwater hazards to navigation, search for and map objects on the seafloor such as shipwrecks, and map the seafloor itself. There are two types of sonar — active and passive. [Source: NOAA]
Active sonar transducers emit an acoustic signal or pulse of sound into the water. If an object is in the path of the sound pulse, the sound bounces off the object and returns an “echo” to the sonar transducer. If the transducer is equipped with the ability to receive signals, it measures the strength of the signal. By determining the time between the emission of the sound pulse and its reception, the transducer can determine the range and orientation of the object.
Passive sonar systems are used primarily to detect noise from marine objects (such as submarines or ships) and marine animals like whales. Unlike active sonar, passive sonar does not emit its own signal, which is an advantage for military vessels that do not want to be found or for scientific missions that concentrate on quietly “listening” to the ocean. Rather, it only detects sound waves coming towards it. Passive sonar cannot measure the range of an object unless it is used in conjunction with other passive listening devices. Multiple passive sonar devices may allow for triangulation of a sound source.
Backscatter is the reflection of a signal (such as sound waves or light) back in the direction from where it originated. Backscatter is commonly used in medical ultrasounds to understand characteristics of the human body, but in the world of hydrography and marine science, backscatter from soundwaves helps us understand characteristics of the sea floor. [Source: NOAA]
NOAA ships equipped with multibeam echo sounders use beams of sound to map the ocean floor. These sonar systems collect two types of 3D data: sea floor depth and backscatter. The sea floor depth, or bathymetry, is computed by measuring the time it takes for the sound to leave the sonar, hit the sea floor, and return to the sonar. Backscatter is computed by measuring the amount of sound that is reflected by the sea floor and received by the sonar.
Different bottom types “scatter” sound energy differently, telling scientists about their relative hardness and roughness. Harder bottom types (like rock) reflect more sound than softer bottom types (like mud), and smoother bottom types (like pavement) reflect more sound than bumpier bottom types (like coral reef).
Combining bathymetry and backscatter data collected by multibeam echo sounders allows scientists to create very detailed 3D maps of the sea floor and the habitats present there. The information is used for multiple purposes, including marine ecosystem protection, coastal hazard preparedness, and navigation safety.
Satellite Altimetry
According to the “Introduction to Physical Oceanography”: Gaps in our knowledge of ocean depths between ship tracks have now been filled by satellite-altimeter data. Altimeters profile the shape of the sea surface, and its shape is very similar to the shape of the sea floor. To see this, we must first consider how gravity influences sea level. Excess mass at the sea floor, for example the mass of a seamount, increases local gravity because the mass of the seamount is larger than the mass of water it displaces. Rocks are more than three times denser than water. The excess mass increases local gravity, which attracts water toward the seamount. This changes the shape of the sea surface. [Source: Robert Stewart, “Introduction to Physical Oceanography”, Texas A&M University, 2008]
Let’s make the concept more exact. To a very good approximation, the sea surface is a particular level surface called the geoid. By definition a level surface is a surface of constant gravitational potential, and it is everywhere perpendicular to gravity. In particular, it must be perpendicular to the local vertical determined by a plumb line, which is “a line or cord having at one end a metal weight for determining vertical direction”
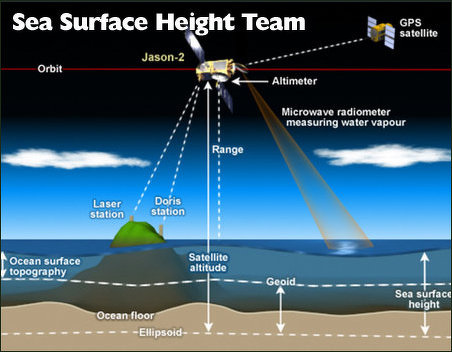
The excess mass of the seamount attracts the plumb line’s weight, causing the plumb line to point a little toward the seamount instead of toward earth’s center of mass. Because the sea surface must be perpendicular to gravity, it must have a slight bulge above a seamount. If there were no bulge, the sea surface would not be perpendicular to gravity. Typical seamounts produce a bulge that is 1–20 meters high over distances of 100–200 kilometers. This bulge is far too small to be seen from a ship, but it is easily measured by satellite altimeters. Oceanic trenches have a deficit of mass, and they produce a depression of the sea surface.
The correspondence between the shape of the sea surface and the depth of the water is not exact. It depends on the strength of the sea floor, the age of the sea-floor feature, and the thickness of sediments. If a seamount floats on the sea floor like ice on water, the gravitational signal is much weaker than it would be if the seamount rested on the sea floor like ice resting on a table top. As a result, the relationship between gravity and sea-floor topography varies from region to region. Depths measured by acoustic echo sounders are used to determine the regional relationships. Hence, altimetry is used to interpolate between acoustic echo sounder measurements.
Bathymetry
Bathymetry is the study of the "beds" or "floors" of water bodies, including the ocean, rivers, streams, and lakes. The term "bathymetry" originally referred to the ocean's depth relative to sea level, although it has come to mean “submarine topography,” or the depths and shapes of underwater terrain. In the same way that topographic maps represent the three-dimensional features (or relief) of overland terrain, bathymetric maps illustrate the land that lies underwater. Variations in sea-floor relief may be depicted by color and contour lines called depth contours or isobaths.
Bathymetry is the foundation of the science of hydrography, which measures the physical features of a water body. Hydrography includes not only bathymetry, but also the shape and features of the shoreline; the characteristics of tides, currents, and waves; and the physical and chemical properties of the water itself.
Robert Stewart wrote in the “Introduction to Physical Oceanography”: “Almost all echo-sounder data have been digitized and combined to make seafloor charts. These data have been supplemented with data from altimetric satellites to produce maps of the sea floor with horizontal resolution around 3 kilometers. [Source: Robert Stewart, “Introduction to Physical Oceanography”, Texas A&M University, 2008]
The British Oceanographic Data Centre publishes the General Bathymetric Chart of the ocean (gebco) Digital Atlas on behalf of the Intergovernmental Oceanographic Commission of UNESCO and the International Hydrographic Organization. The atlas consists primarily of the location of depth contours, coastlines, and tracklines. The original contours were drawn by hand based on digitized echo-sounder data plotted on base maps.
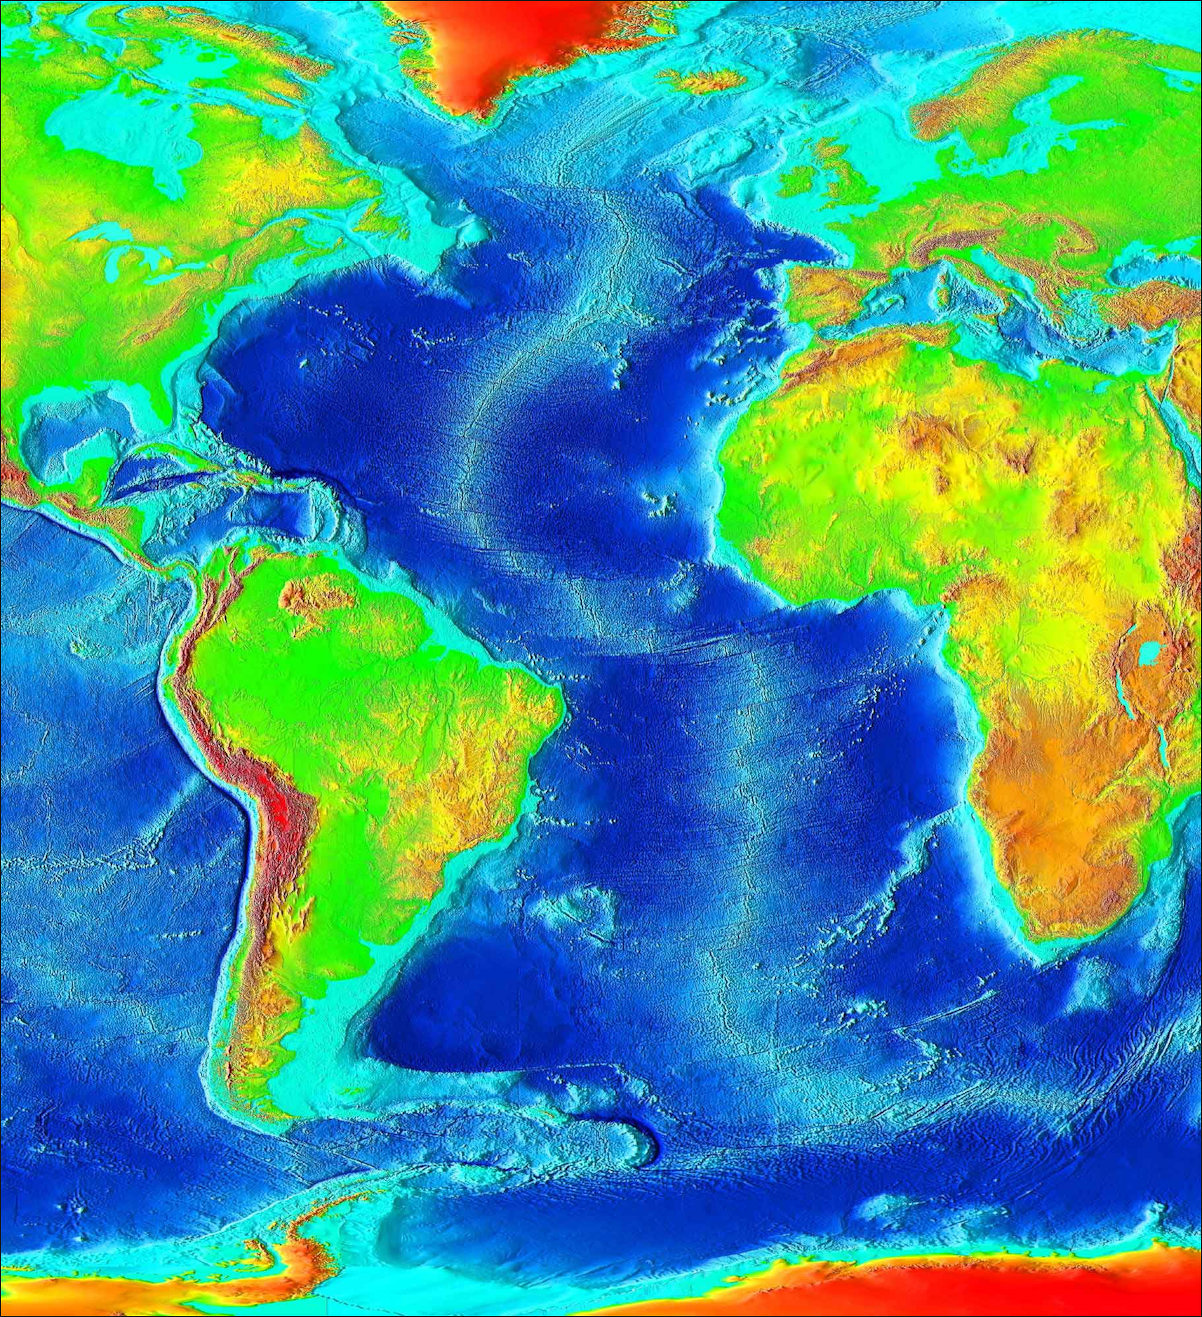
Atlantic bathymetry
The U.S. National Geophysical Data Center publishes digital values of oceanic depths from echo sounders and altimetry and land heights from surveys. Data are interpolated to a 2-minute (2 nautical mile) grid. National governments publish coastal and harbor maps. In the USA, the noaa National Ocean Service publishes nautical charts useful for navigation of ships in harbors and offshore waters.
Bathymetric data, which includes information about the depths and shapes of underwater terrain, has a range of uses: 1) Nautical charts — These charts, based on bathymetric data, guide mariners the same way road maps guide drivers. Having accurate information about the depth of the water and potential underwater hazards is essential for safe maritime transportation, especially for large ships. 2) Studying changing coastline features — Scientists use bathymetric data to study the effects of climate change and to monitor beach erosion, sea level rise, and subsidence (land sinking). 3) Hydrodynamic models — Bathymetric data is used to create models that can calculate currents, tides, water temperature, and salinity in an area. These models can also be used to predict tides and currents, as well as hazards like coastal flooding and rip tides. Studying marine life — Scientists use bathymetric data to study the habitats of benthic (bottom-dwelling) organisms. Bathymetric maps can help scientists determine where fish and other marine life feed, live, and breed. Bathymetric data is also used to create maps of coral habitats to assist in conservation and monitoring.
Ocean Gliders
An ocean glider is an autonomous underwater vehicle used to collect ocean data. It is pre-programmed with travel waypoints and then set free to collect ocean data for days, weeks, or months. Different sensors mounted on the glider collect different kinds of data. One type of gliders is fitted with an acoustic sensor to listen for and record noises made by fish during spawning season. These are used to locate and observe populations of spawning fish. An acoustic receiver to “listen” for vocalizations — grunting sounds — made by some fish as they mass together to spawn in the U.S. Caribbean. The vehicle records the geolocation of the sounds that it “hears” onto an onboard memory card. After collecting data for a set period of time, the glider completes its journey. The glider then surfaces and transmits its position so people can come pick it up. Mission complete!
Since gliders require little or no human assistance while traveling, these little robots are uniquely suited for collecting data in remote locations, safely and at relatively low cost. Gliders may be equipped with a wide variety of sensors to monitor temperature, salinity, currents, and other ocean conditions. This information creates a more complete picture of what is happening in the ocean, as well as trends scientists might not otherwise be able to detect from satellites or large research ships.
While there are many glider designs that use different techniques to move through the water, all gliders share the ability to travel far distances over long periods, without servicing. Unmanned gliders sample the ocean in places where it is impractical to send people, and at a fraction of the cost, allowing us to collect data even in the middle of a hurricane. It is these characteristics along with advancements in sensor technologies that make gliders increasingly important as tools for collecting ocean data.
The Slocum glider looks like a torpedo, but it doesn’t have propellors or an internal engine. Instead, it uses a pump to gently change its buoyancy over time. This allows the glider to slowly move up and down through the water. And as it does so, the big fins sticking out of the sides of the craft create lift to propel it forward. It’s similar to how a glider in the air works, except the ocean glider can glide up as easily as it glides down.
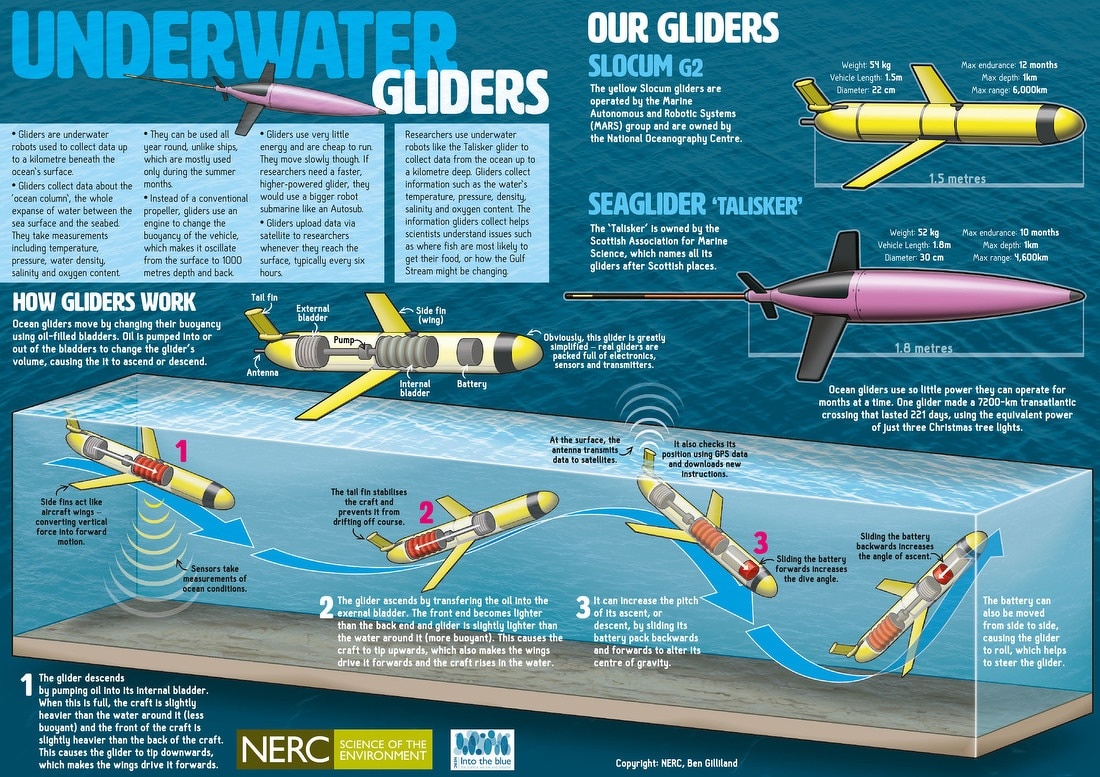
Image Sources: Wikimedia Commons; YouTube, NOAA
Text Sources: National Oceanic and Atmospheric Administration (NOAA) noaa.gov; “Introduction to Physical Oceanography” by Robert Stewart , Texas A&M University, 2008 uv.es/hegigui/Kasper ; Wikipedia, National Geographic, Live Science, BBC, Smithsonian, New York Times, Washington Post, Los Angeles Times, The New Yorker, Reuters, Associated Press, Lonely Planet Guides and various books and other publications.
Last Updated November 2025