Home | Category: Physical Oceanography / Surfing
OCEAN WAVES
 Ocean waves are generally caused by winds. Waves breaking against the shore are called surf. They can vary in height from less than an inch to over six meters (20 feet) and can become even larger than that under special circumstances. The ebb and flow of waves and tides are the life force of our world ocean.
The surface of the ocean is rarely still. Whether observing from the beach or a boat, we expect to see waves on the horizon. Waves are created by energy passing through water, causing it to move in a circular motion. However, water does not actually travel in waves. Waves transmit energy, not water, across the ocean and if not obstructed by anything, they have the potential to travel across an entire ocean basin. [Source: NOAA]
Robert Stewart wrote in the “Introduction to Physical Oceanography”: Waves are undulations of the sea surface, where height is the vertical distance between the bottom of a trough and the top of a nearby crest. The wavelength is the distance between prominent crests. For waves a meter high or the wavelength is generally around 50 to 100 meters. Wave height and wave length are not constant. The heights vary randomly in time and space, and the statistical properties of the waves, such as the mean height averaged for a few hundred waves, change from day to day. [Source: Robert Stewart, “Introduction to Physical Oceanography”, Texas A&M University, 2008]
Related Articles:
OCEANOGRAPHY AND STUDYING THE SEA ioa.factsanddetails.com
PHYSICS OF THE OCEAN: PRESSURE, SOUND AND LIGHT ioa.factsanddetails.com
PHYSICAL FEATURES OF THE OCEAN FLOOR: TRENCHES, VENTS, MOUNTAINS ioa.factsanddetails.com
LARGE WAVES: ROUGE WAVES, METEOTSUNAMIS AND THE BIGGEST WAVES EVER ioa.factsanddetails.com
OCEAN CURRENTS: FORCES, CONCEPTS, TYPES, MAPS ioa.factsanddetails.com
OCEAN TIDES: TYPES, TERMS, FORCES, MEASUREMENTS AND PREDICTIONS ioa.factsanddetails.com
OCEANS, WINDS AND WEATHER ioa.factsanddetails.com
Websites and Resources: National Oceanic and Atmospheric Administration (NOAA) noaa.gov; “Introduction to Physical Oceanography” by Robert Stewart , Texas A&M University, 2008 uv.es/hegigui/Kasper ; Woods Hole Oceanographic Institute whoi.edu ; Cousteau Society cousteau.org ; Monterey Bay Aquarium montereybayaquarium.org
RECOMMENDED BOOKS:
“Waves and Beaches: The Powerful Dynamics of Sea and Coast” by Willard Bascom 2021) Amazon.com
“The Wave: In Pursuit of the Rogues, Freaks, and Giants of the Ocean” by Susan Casey (2010) Amazon.com
“Waves in Oceanic and Coastal Waters” by Leo H. Holthuijsen (2007) Amazon.com
“Waves, Tides and Shallow-Water Processes” Open University(1989) Amazon.com
“Tides: The Science and Spirit of the Ocean” by Jonathan White Amazon.com
“Surf Science” by Tony Butt (2004) Amazon.com
“The Beach Book: Science of the Shore” by Carl H Hobbs (2012) Amazon.com
“Descriptive Physical Oceanography” by Lynne Talley (2017) Amazon.com
“Essentials of Oceanography” by Alam Trujillo and Harold Thurman Amazon.com
“The Blue Machine: How the Ocean Works” by Helen Czerski, explains how the ocean influences our world and how it functions. Amazon.com
“How the Ocean Works: An Introduction to Oceanography” by Mark Denny (2008) Amazon.com
“The Science of the Ocean: The Secrets of the Seas Revealed” by DK (2020) Amazon.com
“Atmospheric and Oceanic Fluid Dynamics: Fundamentals and Large-Scale Circulation” by Geoffrey K. Vallis (2006) Amazon.com
“The Unnatural History of the Sea” by Callum Roberts (Island Press (2009) Amazon.com
“Ocean: The World's Last Wilderness Revealed” by Robert Dinwiddie , Philip Eales, et al. (2008) Amazon.com
“Blue Hope: Exploring and Caring for Earth's Magnificent Ocean” by Sylvia Earle (2014) Amazon.com
“National Geographic Ocean: A Global Odyssey” by Sylvia Earle (2021) Amazon.com
Causes of Waves
Wind-driven waves, or surface waves, are created by the friction between wind and surface water. As wind blows across the surface of the ocean or a lake, the continual disturbance creates a wave crest. These types of waves are found globally across the open ocean and along the coast. [Source: NOAA]
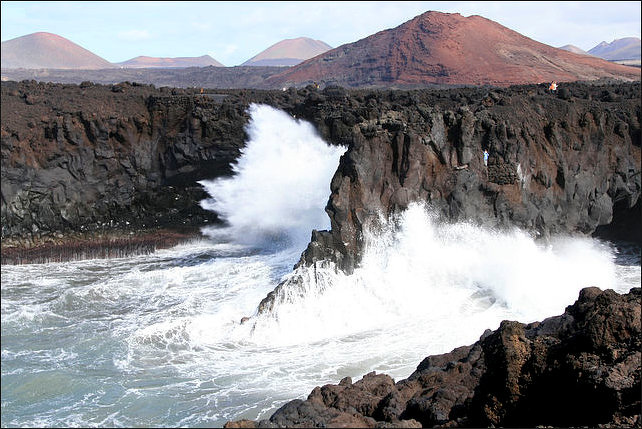
Big waves at Los Hervideros, Lanzarote, Spain in the Atlantic
Potentially hazardous waves caused by severe weather, like hurricanes and typhoons, and strong winds and pressure changes that accompany them, cause storm surge, a series of long waves that are created far from shore in deeper water and intensify as they move closer to land. Other hazardous waves can be caused by underwater disturbances that displace large amounts of water quickly such as earthquakes, landslides, or volcanic eruptions. These very long waves are called tsunamis. Storm surge and tsunamis are not the types of waves you imagine crashing down on the shore. These waves roll upon the shore like a massive sea level rise and can reach far distances inland.
Offshore waves that we observe from the beach are generated by local winds and by distant storms or events. For example, waves breaking on the Southern California may come from vast storms offshore of Antarctica 10,000 kilometers away. The slow rise and fall of sea level due to tides is considered wave activity. Tides have wavelengths of thousands of kilometers, and they are generated by the slow, very small changes in gravity due to the motion of the sun and the moon relative to earth. [Source: Robert Stewart, “Introduction to Physical Oceanography”, Texas A&M University, 2008]
On the question of how waves are generated by the wind, lets begin with a mirror-smooth sea. When a relatively gentle wind of about 15 kilometers per hour (9 mph) suddenly begins to blow steadily: three different physical processes begin: 1) The turbulence in the wind produces random pressure fluctuations at the sea surface, which produces small waves with wavelengths of a few centimeters. 2) Next, the wind acts on the small waves, causing them to become larger. Wind blowing over the wave produces pressure differences along the wave profile causing the wave to grow. The process is unstable because, as the wave gets bigger, the pressure differences get bigger, and the wave grows faster. The instability causes the wave to grow exponentially 3) Finally, the waves begin to interact among themselves to produce longer waves. The interaction transfers wave energy from short waves to waves with frequencies slightly lower than the frequency of waves at the peak of the wave spectrum (See Below). Eventually, this leads to waves going faster than the wind.
Important Wave Concepts
Important concepts in understanding waves ccording to the “Introduction to Physical Oceanography”: 1) Wavelength and frequency of waves are related through the dispersion relation. 2) The velocity of a wave phase can differ from the velocity at which wave energy propagates. 3. Waves in deep water are dispersive, longer wavelengths travel faster than shorter wavelengths. Waves in shallow water are not dispersive. [Source: Robert Stewart, “Introduction to Physical Oceanography”, Texas A&M University, 2008]
4) The dispersion of ocean waves has been accurately measured, and observations of dispersed waves can be used to track distant storms. 5) The shape of the sea surface results from a linear superposition of waves of all possible wavelengths or frequencies travelling in all possible directions. 6) The spectrum gives the contributions by wavelength or frequency to the variance of surface displacement.
Force That Affect Waves
7) Wave energy is proportional to variance of surface displacement. 8) Digital spectra are band limited, and they contain no information about waves with frequencies higher than the Nyquist frequency. 9) Waves are generated by wind. Strong winds of long duration generate the largest waves. 10) Various idealized forms of the wave spectrum generated by steady, homogeneous winds have been proposed. Two important ones are the PiersonMoskowitz and jonswap spectra.
11) Observations by mariners on ships and by satellite altimeters have been used to make global maps of wave height. Wave gauges are used on platforms in shallow water and on the continental shelf to measure waves. Bottom-mounted pressure gauges are used to measure waves just offshore of beaches. And synthetic-aperture radars are used to obtain information about wave directions.
12) The concept of group velocity cg is fundamental for understanding the propagation of linear and nonlinear waves. First, it is the velocity at which a group of waves travels across the ocean. More importantly, it is also the propagation velocity of wave energy. See Linear Waves Below.
Rossby Waves
Waves in the ocean come in many different shapes and sizes. Rossby waves, also known as planetary waves, naturally occur in rotating fluids. Oceanic and atmospheric Rossby waves naturally occur largely due to the Earth's rotation. These waves affect the planet's weather and climate. [Source: NOAA]
Slow-moving oceanic Rossby waves are fundamentally different from ocean surface waves. Unlike waves that break along the shore, Rossby waves are huge, undulating movements of the ocean that stretch horizontally across the planet for hundreds of kilometers in a westward direction. They are so large and massive that they can change Earth's climate conditions. Along with rising sea levels, King Tides, and the effects of El Niño, oceanic Rossby waves contribute to high tides and coastal flooding in some regions of the world.
Rossby wave movement is complex. The horizontal wave speed of a Rossby (the amount of time it takes the wave to travel across an ocean basin) is dependent upon the latitude of the wave. In the Pacific, for instance, waves at lower latitudes (closer to the equator) may take months to a year to cross the ocean. Waves that form farther away from the equator (at mid-latitudes) of the Pacific may take closer to 10 to 20 years to make the journey. The vertical motion of Rossby waves is small along the ocean's surface and large along the deeper thermocline — the transition area between the ocean's warm upper layer and colder depths. This variation in vertical motion of the water's surface can be quite dramatic: the typical vertical movement of the water's surface is generally about 10 centimeters, while the vertical movement of the thermocline for the same wave is approximately 1,000 times greater. In other words, for a 10 centimeter or less surface displacement along the ocean surface, there may be more than 91.4 meters of corresponding vertical movement in the thermocline far below the surface! Due to the small vertical movement along the ocean surface, oceanic Rossby waves are undetectable by the human eye. Scientists typically rely on satellite radar altimetry to detect the massive waves.
According to the National Weather Service, atmospheric Rossby waves form primarily as a result of the Earth's geography. Rossby waves help transfer heat from the tropics toward the poles and cold air toward the tropics in an attempt to return atmosphere to balance. They also help locate the jet stream and mark out the track of surface low pressure systems. The slow motion of these waves often results in fairly long, persistent weather patterns.
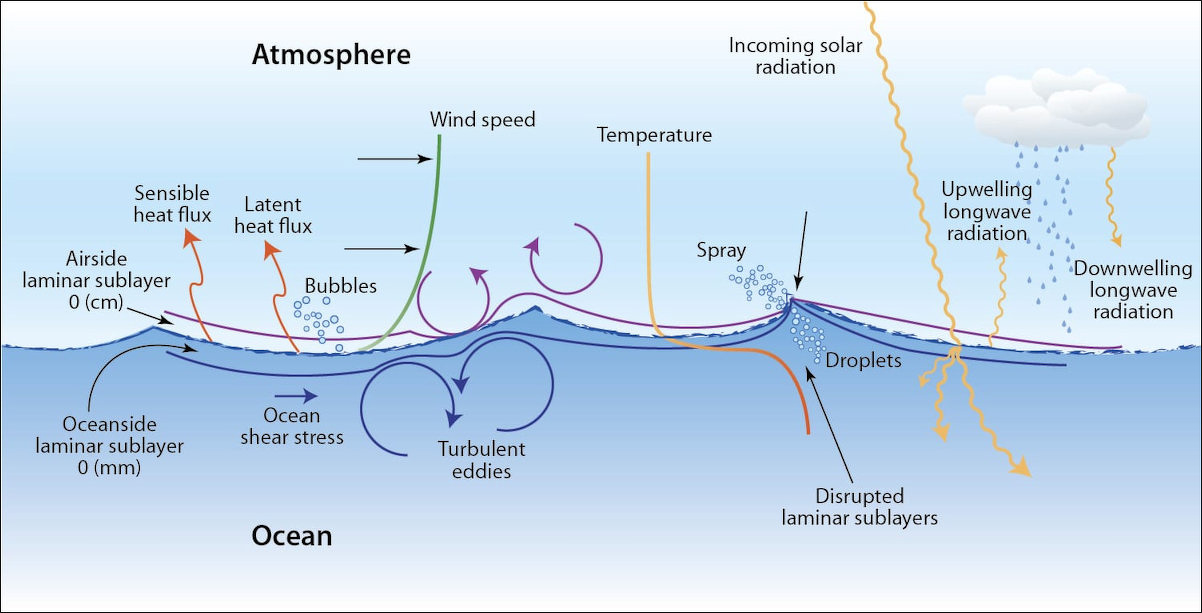
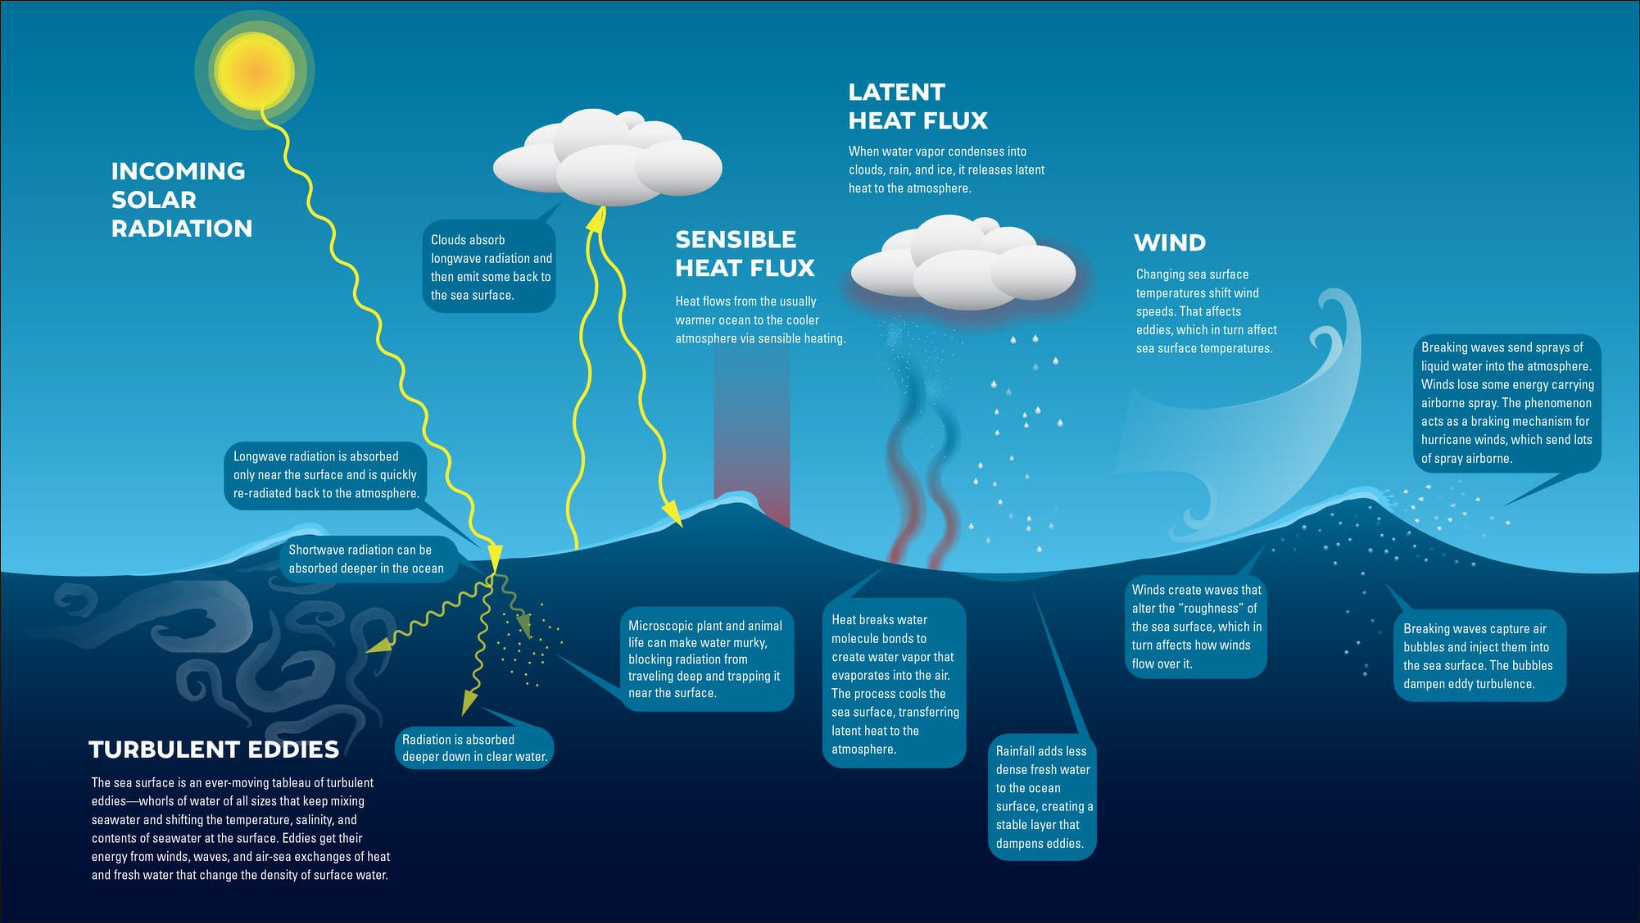
Wind Eddies (Waves)
Linear and Non Linear Waves
Robert Stewart wrote in the “Introduction to Physical Oceanography”:Surface waves are inherently nonlinear: The solution of the equations of motion depends on the surface boundary conditions, but the surface boundary conditions are the waves we wish to calculate. How can we proceed? We begin by assuming that the amplitude of waves on the water surface is infinitely small so the surface is almost exactly a plane. To simplify the mathematics, we can also assume that the flow is 2-dimensional with waves traveling in the x-direction. We also assume that the Coriolis force and viscosity can be neglected. If we retain rotation, we get Kelvin waves. [Source: Robert Stewart, “Introduction to Physical Oceanography”, Texas A&M University, 2008]
With these assumptions, the sea-surface elevation ζ of a wave traveling in the x direction is: ζ = a sin(k x − ω t) with ω = 2πf = 2π T ; k = 2π L, where ω is wave frequency in radians per second, f is the wave frequency in Hertz (Hz), k is wave number, T is wave period, L is wave length, and where we assume, as stated above, that ka = O(0). The wave period T is the time it takes two successive wave crests or troughs to pass a fixed point. The wave length L is the distance between two successive wave crests or troughs at a fixed time.
Wave frequency ω is related to wave number k by the dispersion relation: ω2 = g k tanh(kd), where d is the water depth and g is the acceleration of gravity. Two approximations are especially useful. 1) Deep-water approximation is valid if the water depth d is much greater than the wave length L. In this case, d ≫ L, kd ≫ 1, and tanh(kd) = 1. 2) Shallow-water approximation is valid if the water depth is much less than a wavelength. In this case, d ≪ L, kd ≪ 1, and tanh(kd) = kd.
The phase velocity c is the speed at which a particular phase of the wave propagates, for example, the speed of propagation of the wave crest. In one wave period T the crest advances one wave length L and the phase speed is c = L/T = ω/k. Thus, the definition of phase speed is: c ≡ ω k.
In deep water, the phase speed depends on wave length or wave frequency. Longer waves travel faster. Thus, deep-water waves are said to be dispersive. In shallow water, the phase speed is independent of the wave; it depends only on the depth of the water. Shallow-water waves are non-dispersive.
For more on this See “Introduction to Physical Oceanography” by Robert Stewart , Texas A&M University, 2008 uv.es/hegigui/Kasper
Wave Spectrum
According to the “Introduction to Physical Oceanography”: If we look out to sea, we notice that waves on the sea surface do not have equal height and duration during the crest and the trough. The surface appears to be composed of random waves of various lengths and periods. How can we describe this surface? The answer is, Not very easily.We can however, with some simplifications, come close to describing the surface. The simplifications lead to the concept of the spectrum of ocean waves. The spectrum gives the distribution of wave energy among different wave frequencies or wave lengths on the sea surface. [Source: Robert Stewart, “Introduction to Physical Oceanography”, Texas A&M University, 2008]
Ocean waves are produced by the wind. The faster the wind, the longer the wind blows, and the bigger the area over which the wind blows, the bigger the waves. In designing ships or offshore structures we wish to know the biggest waves produced by a given wind speed. Suppose the wind blows at 20 meters per second for many days over a large area of the North Atlantic. What will be the spectrum of ocean waves at the downwind side of the area?
Various idealized spectra are used to answer the question in oceanography and ocean engineering. Perhaps the simplest is that proposed by Pierson and Moskowitz (1964). They assumed that if the wind blew steadily for a long time over a large area, the waves would come into equilibrium with the wind. This is the concept of a fully developed sea. Here, a “long time” is roughly ten-thousand wave periods, and a “large area” is roughly five-thousand wave lengths on a side. To obtain a spectrum of a fully developed sea, they used measurements of waves made by accelerometers on British weather ships in the north Atlantic.
First, they selected wave data for times when the wind had blown steadily for long times over large areas of the north Atlantic. Then they calculated the wave spectra for various wind speeds (figure 16.7), and they found that the function S(ω) = αg2 ω5 exp ! −β &ω0 ω '4 " (16.28) was a good fit to the observed spectra, where ω = 2πf, f is the wave frequency in Hertz, α = 8.1 × 10⁻³, β = 0.74 , ω0 = g/U19.5 and U19.5 is the wind speed at a height of 19.5 meters above the sea surface, the height of the anemometers on the weather ships used by Pierson and Moskowitz (1964).
For more on this See “Introduction to Physical Oceanography” by Robert Stewart , Texas A&M University, 2008 uv.es/hegigui/Kasper

Large waves off Bermuda from Hurricane Igor
Wave Forecasting
Wave forecasting is generally done using winds calculated from numerical weather models. According to the “Introduction to Physical Oceanography”: If we observe some small ocean area, or some area just offshore, we can see waves generated by the local wind, the wind sea, plus waves that were generated in other areas at other times and that have propagated into the area we are observing, the swell. Forecasts of local wave conditions must include both sea and swell, hence wave forecasting is not a local problem. [Source: Robert Stewart, “Introduction to Physical Oceanography”, Texas A&M University, 2008]
Various techniques have been used to forecast waves. The earliest attempts were based on empirical relationships between wave height and wave length and wind speed, duration, and fetch. The development of the wave spectrum allowed evolution of individual wave components with frequency f travelling in direction θ of the directional wave spectrum ψ(f, θ) using ∂ψ0 ∂t + cg · ∇ψ0 = Si + Snl + Sd, where ψ0 = ψ0(f, θ; x, t) varies in space (x) and time t, Si is input from the wind given by the Phillips and Miles mechanisms, Snl is the transfer among wave components due to nonlinear interactions, and Sd is dissipation.
The third-generation wave-forecasting models now used by meteorological agencies throughout the world are based on integrations of using many individual wave components (The swamp Group 1985; The wamdi Group, 1988; Komen et al, 1996). The forecasts follow individual components of the wave spectrum in space and time, allowing each component to grow or decay depending on local winds, and allowing wave components to interact according to Hasselmann’s theory. Typically the sea is represented by 300 components: 25 wavelengths going in 12 directions (30◦). To reduce computing time, the models use a nested grid of points: the grid has a high density of points in storms and near coasts and a low density in other regions. Typically, grid points in the open ocean are 3◦ apart.
Some recent experimental models take the wave-forecasting process one step further by assimilating altimeter and scatterometer observations of wind speed and wave height into the model. Forecasts of waves using assimilated satellite data are available from the European Centre for Medium-Range Weather Forecasts. NOAA’S Ocean Modeling Branch at the National Centers for Environmental Predictions also produces regional and global forecasts of waves. The Branch use a third-generation model based on the Cycle-4 wam model. It accommodates ever-changing ice edge, and it assimilates buoy and satellite altimeter wave data. The model calculates directional frequency spectra in 12 directions and 25 frequencies at 3-hour intervals up to 72 hours in advance.
Measurement of Waves
Robert Stewart wrote in the “Introduction to Physical Oceanography”: Because waves influence so many processes and operations at sea, many techniques have been invented for measuring waves. Here are a few of the more commonly used. 1) Sea State Estimated by Observers at Sea This is perhaps the most common observation included in early tabulations of wave heights. These are the significant wave heights summarized in the U.S. Navy’s Marine Climatological Atlas and other such reports printed before the age of satellites. [Source: Robert Stewart, “Introduction to Physical Oceanography”, Texas A&M University, 2008]

2) Satellite Altimeters are used to measure surface geostrophic currents also measure wave height. Altimeters were flown on Seasat in 1978, Geosat from 1985 to 1988, ers–1 &2 from 1991, Topex/Poseidon from 1992, and Jason from 2001. Altimeter data have been used to produce monthly mean maps of wave heights and the variability of wave energy density in time and space. The next step, just begun, is to use altimeter observation with wave forecasting programs, to increase the accuracy of wave forecasts. The altimeter technique works as follows. Radio pulse from a satellite altimeter reflect first from the wave crests, later from the wave troughs. The reflection stretches the altimeter pulse in time, and the stretching is measured and used to calculate wave height (figure 16.11). Accuracy is ±10 percent.
3) Accelerometers mounted on meteorological bouys or other kinds buoys are less commonly used, although they are often used for measuring waves during short experiments at sea. Accelerometers on weather ships have been used to measure wave height. The most accurate measurements are made using an accelerometer stabilized by a gyro so the axis of the accelerometer is always vertical. Double integration of vertical acceleration gives displacement. The double integration, however, amplifies low-frequency noise, leading to the low frequency signals. In addition, the buoy’s heave is not sensitive to wavelengths less than the buoy’s diameter, and buoys measure only waves having wavelengths greater than the diameter of the buoy. Overall, careful measurements are accurate to ± 10 percent or better.
4) Wave Gages may be mounted on platforms or on the sea floor in shallow water. Many different types of sensors are used to measure the height of the wave or subsurface pressure which is related to wave height. Sound, infrared beams, and radio waves can be used to determine the distance from the sensor to the sea surface provided the sensor can be mounted on a stable platform that does not interfere with the waves. Pressure gauges can be used to measure the depth from the sea surface to the gauge. Arrays of bottom-mounted pressure gauges are useful for determining wave directions. Thus arrays are widely used just offshore of the surf zone to determine offshore wave directions. Pressure gauge must be located within a quarter of a wavelength of the surface because wave-induced pressure fluctuations decrease exponentially with depth. Thus, both gauges and pressure sensors are restricted to shallow water or to large platforms on the continental shelf. Again, accuracy is ± 10 percent or better.
5) Synthetic Aperture Radars on Satellites map the radar reflectivity of the sea surface with spatial resolution of 6–25 meters. Maps of reflectivity often show wave-like features related to the real waves on the sea surface. I say ‘wave-like’ because there is not an exact one-to-one relationship between wave height and image density. Some waves are clearly mapped, others less so. The maps, however, can be used to obtain additional information about waves, especially the spatial distribution of wave directions in shallow water. Because the directional information can be calculated directly from the radar data without the need to calculate an image, data from radars and altimeters on ERS–1 and 2 (satellites) were used to determine if the radar and altimeter observations can be used directly in wave forecast programs.

Pink Waves
In January 2023, San Diego's waves turned bright pink. CBS News reported: The usual blue waters of the Pacific Ocean off the coast of San Diego are looking quite different — at least for a while. Bright fuchsia-colored waves were seen crashing along the shore in the past week, and researchers have revealed just what's causing the sudden and dramatic color change...It's science. [Source: Li Cohen, CBS News, January 27, 2023]
“Scripps Institution of Oceanography said it was responsible for the temporary color change at Torrey Pines State Beach. Researchers are conducting a study, called Plumes in Nearshore Conditions, or PiNC, to learn more about how freshwater interacts with salt water near shore. By releasing a non-toxic pink dye in the nearby Los Peñasquitos Lagoon coastal estuary, researchers say they are able to monitor what happens to that water when "small-scale plumes" end up in the surf zone along the beach, where the waves break.
“This research, Scripps said, will "provide a first-ever view" of how freshwater mixes with the more dense ocean water within waves. That information, they said, is crucial for understanding how sediments, pollutants, larvae and other materials disperse throughout shorelines. The pink plume in this study will be monitored with various instruments, from land, sea and air. The dye being used poses "no threat to humans, wildlife or the environment," Scripps said, although civilians have been urged to not swim in the area due to the ongoing research.
“During a release, researchers put 15 gallons of the dye into the estuary as the tide level is falling. The researchers say the bright pink coloration is then visible to the naked eye for several hours, and small traces are able to be detected for about 24 hours. The first experiment saw "much success," researchers said on their website. The dye revealed that the initial plume was trapped in the surf zone but that it was eventually carried south with some of the plume getting ejected from the surf zone.
Image Sources: Wikimedia Commons; YouTube, NOAA
Text Sources: National Oceanic and Atmospheric Administration (NOAA) noaa.gov; “Introduction to Physical Oceanography” by Robert Stewart , Texas A&M University, 2008 uv.es/hegigui/Kasper ; Wikipedia, National Geographic, Live Science, BBC, Smithsonian, New York Times, Washington Post, Los Angeles Times, The New Yorker, Reuters, Associated Press, Lonely Planet Guides and various books and other publications.
Last Updated March 2023