Home | Category: Commercial and Sport Fishing and Fish
FISH CONSUMPTION

Drum net seiner, a kind of fishing boat In 2021, approximately 92.6 million metric tons of fish were captured in the wild, while 85.5 million metric tons was produced by aquaculture. The demand for seafood has outpaced world’s population growth. Seafood consumption rose 30 percent from 16 kilograms (35 pounds) per person in 1998 to 20.5 kilograms (45 pounds) per person in 2018, according to the United Nations. The estimated global catch in 2018 was 107 million tons, nearly twice what it was in the late 1960s. [Sources: Statista; Tristram Korten, Smithsonian magazine, September 2020]
According to a United Nations Food and Agriculture Organization (FAO) report issued in June 2020 worldwide per capita fish consumption has been rising by an average rate of 3.1 percent since 1961. This outpaces all other animal proteins. Fish consumption accounts for a sixth of the global population's intake of animal proteins, and more than half in countries such as Bangladesh, Cambodia, the Gambia, Ghana, Indonesia, Sierra Leone and Sri Lanka. The FAO projected global per capita consumption would climb to 21.5 kilograms by 2030, a slowdown in the average annual growth rate to 0.4 percent, with a decline expected in Africa. [Source: Reuters, June 8, 2020]
About 80 million tons of marine animals were caught every year in the 2000s, four times more than half a century ago. The global harvest of fish increased from 17 million metric tons in 1950 to 78 million metric tons in the mid-1980s and then leveled off. The figure was 81.6 million tons in 2000. As fish stocks in the ocean decline fish farming is seen as critical to supplying an extra 40 million metric tons of seafood a year needed to keep up with demand.
Books: “Saved by the Sea: A Love Story with Fish” by David Helvarg (St. Martin’s, 2010); “Managed Annihilation: An Unnatural History of the Newfoundland Cod Collapse” by Dean Bavington, (University of British Columbia; 2010); “Four Fish: The Future of the Last Wild Food” by Paul Greenberg (Penguin Press, 2010)
Related Articles: HISTORY OF FISHING: IN THE PREHISTORIC, ANCIENT, MEDIEVAL AND MODERN ERAS ioa.factsanddetails.com ; BENEFITS OF EATING FISH AND CHOOSING THE BEST FISH TO EAT ioa.factsanddetails.com ; COMMERCIAL FISHING INDUSTRY: TECHNOLOGY, SECTORS, PROBLEMS ioa.factsanddetails.com ; TYPES OF COMMERCIAL FISHING AND NETS: TRAWLING, LONGLINES, PURSE SEINERS ioa.factsanddetails.com ; OVERFISHING: CAUSES, EFFECTS AND SOLUTIONS ioa.factsanddetails.com ; ILLEGAL OCEAN FISHING ioa.factsanddetails.com ; AQUACULTURE AND FISH FARMS ioa.factsanddetails.com ; CATEGORY: COMMERCIAL AND SPORT FISHING AND FISH ioa.factsanddetails.com
Increased Demand for Fish

Loading salmon in the 1950sDemand for fish is growing fast, most dramatically in East Asia. According to International Food Policy Research Institute research fellow Siwa Msangi, the rise in demand is largely being driven by China. Almost 50 percent of the increase in the world's fish consumption for food comes from Eastern Asia, and "42 percent of that increase is coming from China itself," he said. [Source: Marc Kaufman, Washington Post, February 20, 2011]
"China is a driver of both the demand and the supply side. That is really why the management issue becomes so important," Msangi said. "Projections about future fish populations decline further, however, when coupled with forecasts about the impact of climate change," which is expected to warm the oceans considerably.
Americans ate about 2 million tons of seafood in 2011, second only to China. They spent more than $85 billion on fish — much of it harvested within the country. Tuna, pollock, crab and cod are Americans’ wild-caught favorites. In 2006, Top fish consumers per person (including caught and farmed fish): 1) Japan, 66 kilograms; 2) China, 56 kilograms; 3) the United States, 47 kilograms; 4) Indonesia, 20.2 kilograms; 5) Russia, 19.1 kilograms. [Source: Washington Post, NOAA]
The consumption of fish is increasing as the population of the world grows and more and more people are eating more and more fish. In the developed world many people who didn’t eat much fish before are now eating it for health reasons. In the developing world incomes are increasing and many people who couldn’t afford fish in the past now can. Fish has traditionally been a major source of protein for the poor in the developing world.
True Size of the World’s Fish Catch
The fish market was valued at US$406 billion in 2021 and global fisheries and aquaculture production reached an all-time high of 214 million metric tons in 2020 — according to the UN State of World Fisheries and Aquaculture Report 2022. [Source: Martina Iginia, Earth.org. July 15 2022]
Paul Greenberg wrote in National Geographic, Every year more than 170 billion pounds (77.9 million metric tons) of wild fish and shellfish are caught in the oceans — roughly three times the weight of every man, woman, and child in the United States. Fisheries managers call this overwhelming quantity of mass-hunted wildlife the world catch, and many maintain that this harvest has been relatively stable over the past decade. But an ongoing study conducted by Daniel Pauly, a fisheries scientist at the University of British Columbia, in conjunction with Enric Sala, a National Geographic fellow, suggests that the world catch is neither stable nor fairly divided among the nations of the world. In the study, called SeafoodPrint and supported by the Pew Charitable Trusts and National Geographic, the researchers point the way to what they believe must be done to save the seas. [Source: Paul Greenberg, National Geographic, October 2010, Paul Greenberg is the author of “Four Fish: The Future of the Last Wild Food”]
They hope the study will start by correcting a common misperception. The public imagines a nation's impact on the sea in terms of the raw tonnage of fish it catches. But that turns out to give a skewed picture of its real impact, or seafood print, on marine life. "The problem is, every fish is different," says Pauly. "A pound of tuna represents roughly a hundred times the footprint of a pound of sardines."
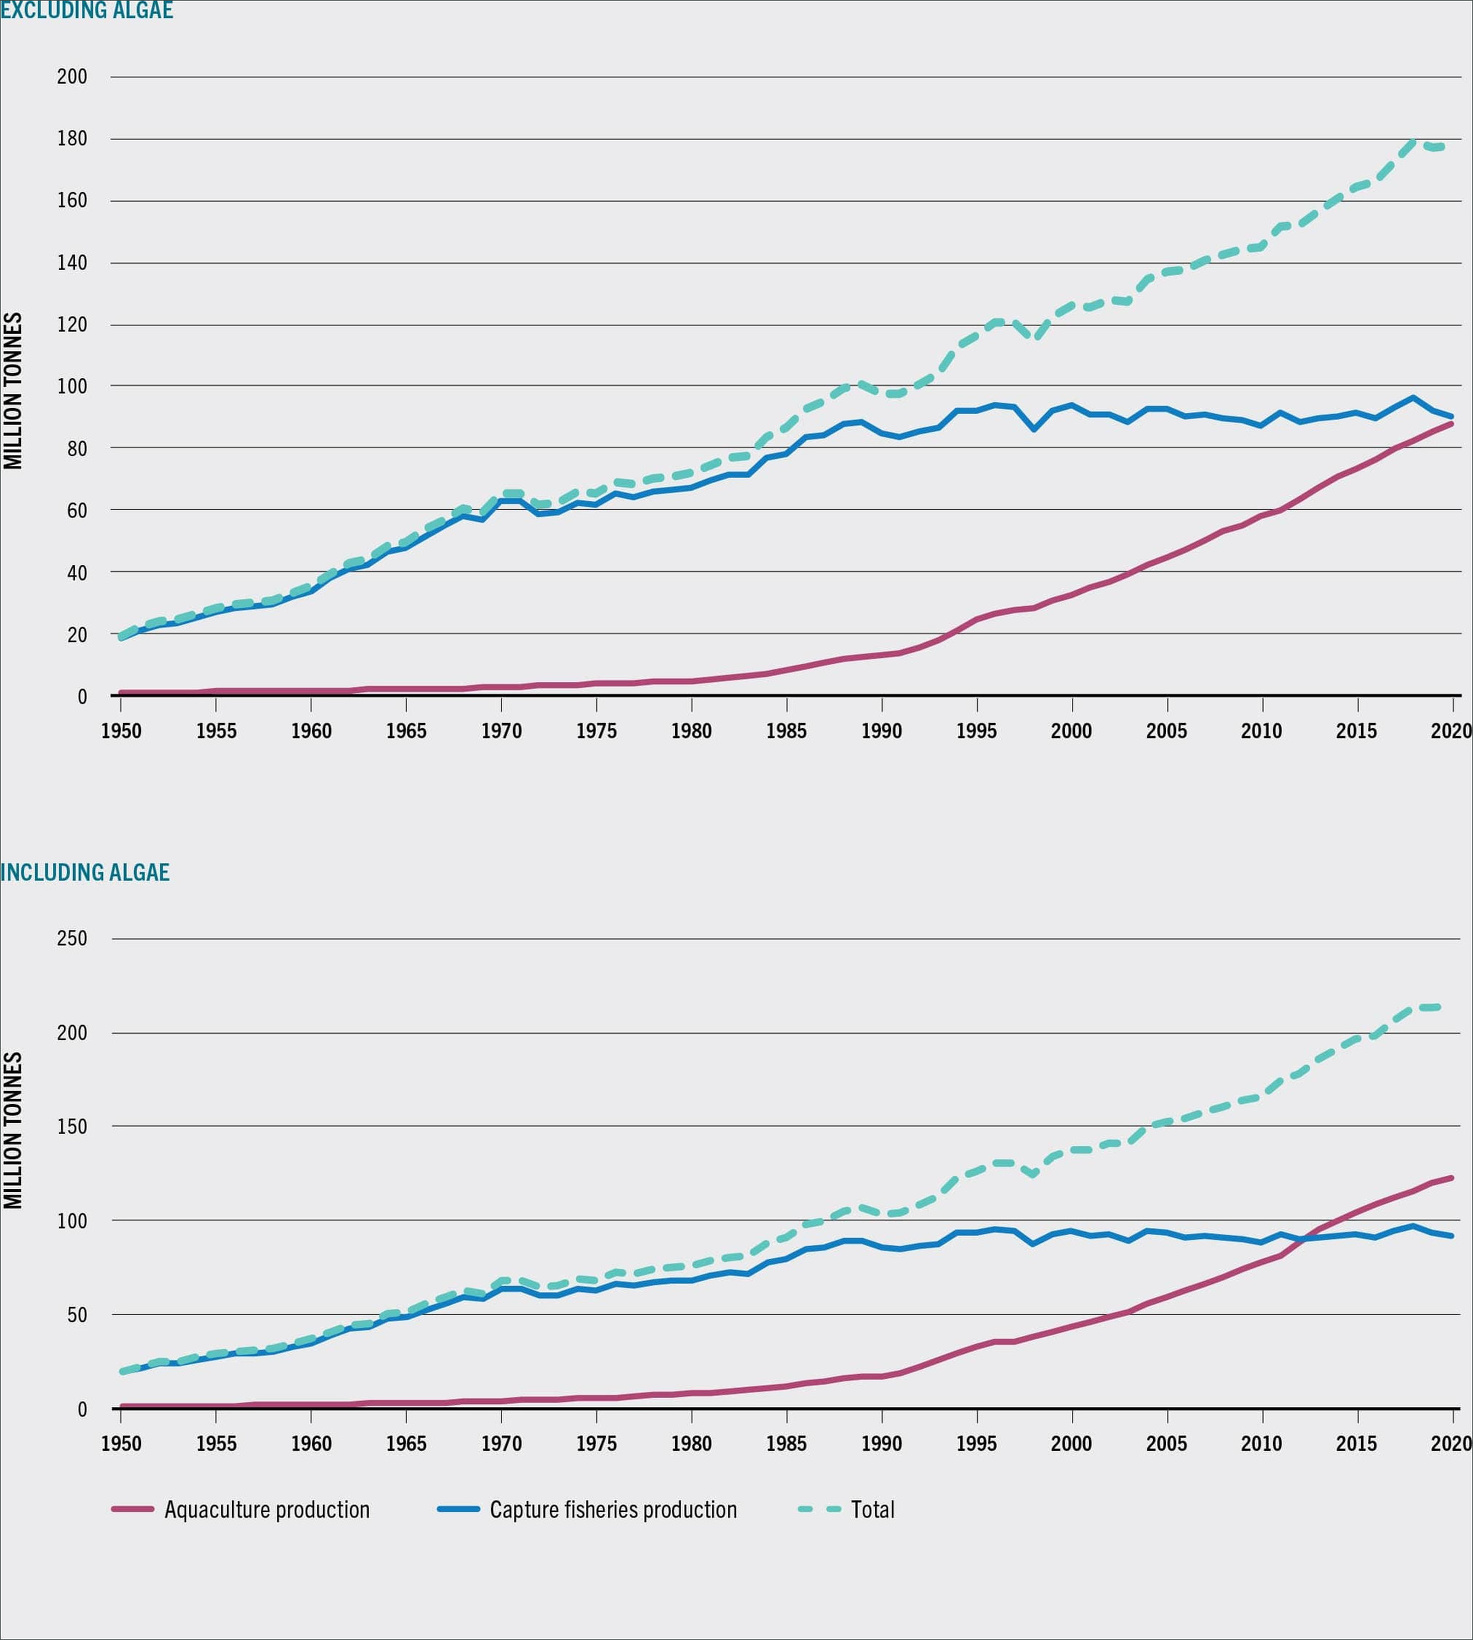
World Capture Fisheries and Aquaculture Production (Excluding and Including Algae (Seaweed))
The reason for this discrepancy is that tuna are apex predators, meaning that they feed at the very top of the food chain. The largest tuna eat enormous amounts of fish, including intermediate-level predators like mackerel, which in turn feed on fish like anchovies, which prey on microscopic copepods. A large tuna must eat the equivalent of its body weight every ten days to stay alive, so a single thousand-pound tuna might need to eat as many as 15,000 smaller fish in a year. Such food chains are present throughout the world's ocean ecosystems, each with its own apex animal. Any large fish — a Pacific swordfish, an Atlantic mako shark, an Alaska king salmon, a Chilean sea bass — is likely to depend on several levels of a food chain.
To gain an accurate picture of how different nations have been using the resources of the sea, the SeafoodPrint researchers needed a way to compare all types of fish caught. They decided to do this by measuring the amount of "primary production" — those microscopic organisms at the bottom of the marine food web — required to make a pound of a given type of fish. They found that a pound of bluefin tuna, for example, might require a thousand pounds or more of primary production.
In assessing the true impact that nations have on the seas, the team needed to look not just at what a given nation caught but also at what the citizens of that nation ate. "A country can acquire primary production by fishing, or it can acquire it by trade," Pauly says. "It is the sheer power of wealthy nations to acquire primary production that is important."
Leading Fishing Nations
World capture fisheries for fish, crustaceans, molluscs, etc from 2018
Country — Fishing Catch
1) China — 17,800,000
2) Indonesia — 6,584,419
3) India — 5,082,332
4) United States — 4,931,017
5) Russia — 4,773,413
6) Peru — 3,811,802
7) Japan — 3,275,263
8) Vietnam — 2,785,940
9) Norway — 2,203,360
10) Myanmar — 2,072,390
[Source: FAO's Statistical Yearbook 2021, Wikipedia]

Regional Contribution to World Capture Fisheries and Aquaculture Production [Source: FAO]
11) Philippines — 2,027,992
12) Bangladesh — 1,674,770
13) Chile — 1,829,238
14) Thailand — 1,530,583
15) Malaysia — 1,584,371
16) Mexico — 1,524,467
17) Morocco — 1,454,105
18) South Korea — 1,395,951
19) Iceland — 1,085,176
20) Spain — 915,137
21) Canada — 874,727
22) Argentina — 755,226
23) Nigeria — 734,731
24) Ecuador — 715,495
25) Brazil — 705,000
26) United Kingdom — 702,405
27) Iran — 695,407
28) Cambodia — 629,950
20) Egypt — 335,614
30) North Korea — 209,000
Leading Fishing and Aquaculture Nations
World capture fisheries and aquaculture production for fish, crustaceans, molluscs, etc from 2018
Country — Capture — Aquaculture — Total
1) China — 17,800,000 — 63,700,000 — 81,500,000
2) Indonesia — 6,584,419 — 16,600,000 — 23,200,000

Russian fishing statistics
3) India — 5,082,332 — 5,703,002 — 10,800,000
4) Vietnam — 2,785,940 — 3,634,531 — 6,420,471
5) United States — 4,931,017 — 444,369 — 5,375,386
6) Russia — 4,773,413 — 173,840 — 4,947,253
7) Japan — 3,275,263 — 1,067,994 — 4,343,257
8) Philippines — 2,027,992 — 2,200,914 — 4,228,906
9) Peru — 3,811,802 — 100,187 — 3,911,989
10) Bangladesh — 1,674,770 — 2,203,554 — 3,878,324
[Source: FAO's Statistical Yearbook 2021, Wikipedia]
11) Norway — 2,203,360 — 1,326,216 — 3,529,576
12) South Korea — 1,395,951 — 1,859,220 — 3,255,171
13) Myanmar — 2,072,390 — 1,017,644 — 3,090,034
14) Chile — 1,829,238 — 1,050,117 — 2,879,355
15) Thailand — 1,530,583 — 962,571 — 2,493,154
16) Malaysia — 1,584,371 — 407,887 — 1,992,258
17) Mexico — 1,524,467 — 221,328 — 1,745,795
18) Egypt — 335,614 — 1,370,660 — 1,706,274
19) Morocco — 1,454,105 — 1,142 — 1,455,247
20) Brazil — 705,000 — 581,230 — 1,286,230
21) Spain — 915,137 — 283,831 — 1,198,968
22) Ecuador — 715,495 — 451,090 — 1,166,585
23) Iceland — 1,085,176 — 15,129 — 1,100,305
24) Iran — 695,407 — 398,129 — 1,093,536
25) Canada — 874,727 — 200,765 — 1,075,492
26) Nigeria — 734,731 — 306,727 — 1,041,458
27) United Kingdom — 702,405 — 194,492 — 896,897
28) Cambodia — 629,950 — 172,500 — 802,450
29) North Korea — 209,000 — 554,100 — 763,100
30) Argentina — 755,226 — 3,673 — 758,900
Fishing Catches by Nation in the Past
Top fishing nations (catch in millions of metric tons); 1) China (44.3); 2) Peru (8.88); 3) India (6.06); 4) United States (5.44); and 5) Indonesia (5.42). China’s catch in 1990 was 13.44 million tons. [Source: 2006 NOAA]
Largest harvesters of fish (metric tons): 1) Japan (7.5 million); 2) China (7 million); 3) Peru (6.7 million); 4) Chile (6.5 million); 5) Russia (5.2 million); 6) the U.S. (5 million). [Source: National Geographic]
Top fish consumers per person (including caught and farmed fish): 1) Japan, 66 kilograms; 2) China, 56 kilograms; 3) the United States, 47 kilograms; 4) Indonesia, 20.2 kilograms; 5) Russia, 19.1 kilograms. [Source: 2006 NOAA]
Top fishing nations (2000, annual marine catch in millions of tons): 1) China (17); 2) Peru (10.7 ); 3) Japan (5); 4) the United States (4.7); 5) Chile (5.3); 6) Indonesia (4.1); 7) Russia (4); 8) India (3.6); 9) Thailand (2.9); 10) Norway (2.7); 11) Iceland (2); 12) Philippines (1.9) [Source: FAO]
Top fishing nations (1997, annual marine catch in millions of tons): 1) China (11.6); 2) Peru (8.9); 3) Chile (7.4); 4) Japan (5.9); 5) the United States (5.2); 6) Russia (4.3); 7) Indonesia (3.5); 8) India (3.3); 9) Thailand (3.0); 10) Norway (2.5); 11) South Korea (2.3).
In the 1970s, most nations pushed their territorial control from 12 to 200 nautical miles offshore in accordance with United Nation laws that allowed them to extend their exclusive economic zones (EEZs) that far offshore. Some small island countries have huge Eezs that are hundreds of times larger than the nations themselves. Fishermen that catch fish in the exclusive economic of foreign countries are required to pay fishing fees.
The international fishing industry is highly unregulated. In some places the fishing industry is heavily subsidized and more money is spent catching fish than is earned from selling them. Some parts of the open sea are like the Wild West. Some of the worst fishing practices are carried out by rogue vessels associated mainly with Taiwanese companies. In 2003, Australian vessels chased a Uruguayan flagged fishing vessel caught poaching Patagonian toothfish in Antarctic seas for 21 days.
Fishing Studies

traditional sailboat in Mozambique Scientist studying overfishing have two ways of counting fish. The first is to return to the same place every year at the same time and count fish trawled with the same equipment. The second is to rely on data provided by commercial fisherman. The second method is much less reliable than the first.
The Census of Marine Life aims to identify, track and analyze the habits and movements of scores of different sea creatures to access to overall health of the oceans and it life and study how this will impact fishing and marine ecology. The projects involves tagging a variety of fish and tracking their movements with satellites, observing schools of fish with aircraft outfit with laser-based radars, and observing sea creatures with robots and scuba divers. See Census of Marine Life.
Among the questions scientist hope get a grip on is the impact of overfishing and pollution on marine environments, access the health of known marine communities and find new species. One robot planted two miles down in the Atlantic Ocean on average found 30 previously unknown species of animal and plant a week.
World Is Running out of Places to Catch Wild Fish, Study Finds
Paul Greenberg wrote in National Geographic, “Humanity's demand for seafood has now driven fishing fleets into every virgin fishing ground in the world. There are no new grounds left to exploit. But even this isn't enough. An unprecedented buildup of fishing capacity threatens to outstrip seafood supplies in all fishing grounds, old and new. A report by the World Bank and the Food and Agriculture Organization (FAO) of the United Nations recently concluded that the ocean doesn't have nearly enough fish left to support the current onslaught. Indeed, the report suggests that even if we had half as many boats, hooks, and nets as we do now, we would still end up catching too many fish. [Source: Paul Greenberg, National Geographic, October 2010]
Juliet Eilperin wrote in the Washington Post: “Global fisheries have expanded so rapidly over the past half-century that the world is running out of places to catch wild fish, according to a study conducted by researchers in Canada, the United States and Australia. The findings, published in the online journal PLoS ONE, are the first to examine how marine fisheries have expanded over time. Looking at fleets' movements between 1950 and 2005, the five researchers charted how fishing has been expanding southward into less exploited seas at roughly one degree latitude each year to compensate for the fact that humans have depleted fish stocks closer to shore in the Northern Hemisphere. [Source: Juliet Eilperin, Washington Post, December 2, 2010]
During that same period the world's fish catch increased fivefold from 19 million metric tons in 1950 to a peak of 90 million in the late 1980s, before declining to 87 million tons in 2005. It was 79.5 million tons in 2008, according to the U.N. Food and Agriculture Organization, the most recent year for which figures are available.
Daniel Pauly, a co-author who serves as principal investigator of the Sea Around Us Project at the University of British Columbia Fisheries Centre, said the global seafood catch is dropping "because there's essentially nowhere to go." The fact that fish catches rose for so many decades "looks like sustainability but it is actually expansion driven. That is frightening, because the accounting is coming now." The authors - including lead author Wilf Swartz, who is a doctoral student at the university, and National Geographic Society ocean fellow Enric Sala - write that this relentless pursuit for seafood has left "only unproductive waters of high seas, and relatively inaccessible waters in the Arctic and Antarctic as the last remaining 'frontiers.' " "The focus should move from looking for something new to looking at what we have and making the most sustainable use out of it," Swartz said in an interview.
Global Warming and Fishing

Japanese eel fishing boats Villy Christensen of University of British Columbia's Fisheries Centre told the Washington Post, "Our study indicates indeed we may get a double whammy from climate change...Higher water temperatures are going to mean fewer fish in the ocean and less plant life for them. This will be especially true in the tropical areas." [Source: Marc Kaufman, Washington Post, February 20, 2011]
Christensen gave an example of the kind of dynamics he expects to see more and more in the oceans. Some years ago, a huge sardine fishery off Namibia in southern Africa crashed because of overfishing and a related drop in oxygen in the waters. When the sardines are depleted, he said, generally anchovies move in. Both can be consumed, but sardines bring a much higher price and so are preferred.
With so many anchovies and so few sardines, fishing fleets decided to work toward greatly reducing the anchovy population in the expectation that the sardines would come back. But instead of sardines, the fish that moved into the niche was the bearded goby - which is inedible for humans and eats up the ocean food that might one day again have supported sardines or anchovies. "Nobody," Christensen said, "can control the ocean."
Wealthy Nations, Fish Consumption and Overfishing
Paul Greenberg wrote in National Geographic, “Nations with money tend to buy a lot of fish, and a lot of the fish they buy are large apex predators like tuna. Japan catches less than five million metric tons of fish a year, a 29 percent drop from 1996 to 2006. But Japan consumes nine million metric tons a year, about 582 million metric tons in primary-production terms. Though the average Chinese consumer generally eats smaller fish than the average Japanese consumer does, China's massive population gives it the world's biggest seafood print, 694 million metric tons of primary production. The U.S., with both a large population and a tendency to eat apex fish, comes in third: 348.5 million metric tons of primary production. And the size of each of these nations' seafood prints is growing. What the study points to, Pauly argues, is that these quantities are not just extremely large but also fundamentally unsustainable. [Source: Paul Greenberg, National Geographic, October 2010]
Exactly how unsustainable can be seen in global analyses of seafood trade compiled by Wilf Swartz, an economist working on SeafoodPrint. Humanity's consumption of the ocean's primary production changed dramatically from the 1950s to the early 2000s. In the 1950s much less of the ocean was being fished to meet our needs. But as affluent nations increasingly demanded apex predators, they exceeded the primary-production capacities of their exclusive economic zones, which extend up to 200 nautical miles from their coasts. As a result, more and more of the world's oceans had to be fished to keep supplies constant or growing.
Areas outside of these zones are known in nautical parlance as the high seas. These vast territories, the last global commons on Earth, are technically owned by nobody and everybody. The catch from high-seas areas has risen to nearly ten times what it was in 1950, from 1.6 million metric tons to around 13 million metric tons. A large part of that catch is high-level,high-value tuna, with its huge seafood print.

World plankton prevalence
The wealthier nations that purchase most of the products of these fisheries are essentially privatizing them. Poorer countries simply cannot afford to bid for high-value species. Citizens in these nations can also lose out if their governments enter into fishing or trade agreements with wealthier nations. In these agreements local fish are sold abroad and denied to local citizens — those who arguably have the greatest need to eat them and the greatest right to claim them.
Although supermarkets in developed nations like the U.S. and Japan still abound with fish flesh, SeafoodPrint suggests that this abundance is largely illusory because it depends on these two troubling phenomena: broader and broader swaths of the high seas transformed from fallow commons into heavily exploited, monopolized fishing grounds; and poor nations' seafood wealth spirited away by the highest bidder.
Given such tools, policymakers might be in a better position to establish who is taking what from the sea and whether that is just and sustainable. As a global study, SeafoodPrint makes clear that rich nations have grossly underestimated their impacts. If that doesn't change, the abundance of fish in our markets could drop off quickly. Most likely the wealthy could still enjoy salmon and tuna and swordfish. But middle-class fish-eaters might find their seafood options considerably diminished, if not eliminated altogether.
Marine and Freshwater Fishing Versus Aquaculture
According to the FAO: Of the total production in 2020 and 2021, 63 percent (112 million tonnes) was harvested in marine waters (70 percent from capture fisheries and 30 percent from aquaculture) and 37 percent (66 million tonnes) in inland waters (83 percent from aquaculture and 17 percent from capture fisheries) (Figure 4). [Source: “The State of World Fisheries and Aquaculture 2022" by the Food and Agriculture Organization of the United Nations (FAO)]
The expansion of aquaculture in the last few decades has boosted the overall growth of production in inland waters. Despite this growth, capture fisheries in marine waters still represent the main source of production (44 percent of total aquatic animal production in 2020, compared with about 87 percent in the 1950–1980 period) and the dominant method of production for several species. Following several decades of sustained growth, marine capture fisheries have remained fairly stable since the late 1980s at around 80 million tonnes, with some interannual fluctuations (up and down) in the range of 3–4 million tonnes.
This general trend masks considerable variations between continents, regions and countries. In 2020, Asian countries were the main producers, accounting for 70 percent of the total fisheries and aquaculture production of aquatic animals, followed by countries in the Americas (12 percent), Europe (10 percent), Africa (7 percent) and Oceania (1 percent). Overall, total fisheries and aquaculture production has seen important increases in all the continents in the last few decades. The exceptions are Europe (with a gradual decrease from the late 1980s, but recovering slightly in the last few years to 2018, to then decline again) and the Americas (with several ups and downs since the peak of the mid-1990s, mainly due to fluctuations in catches of anchoveta), whereas it has almost doubled during the last 20 years in Africa and Asia.
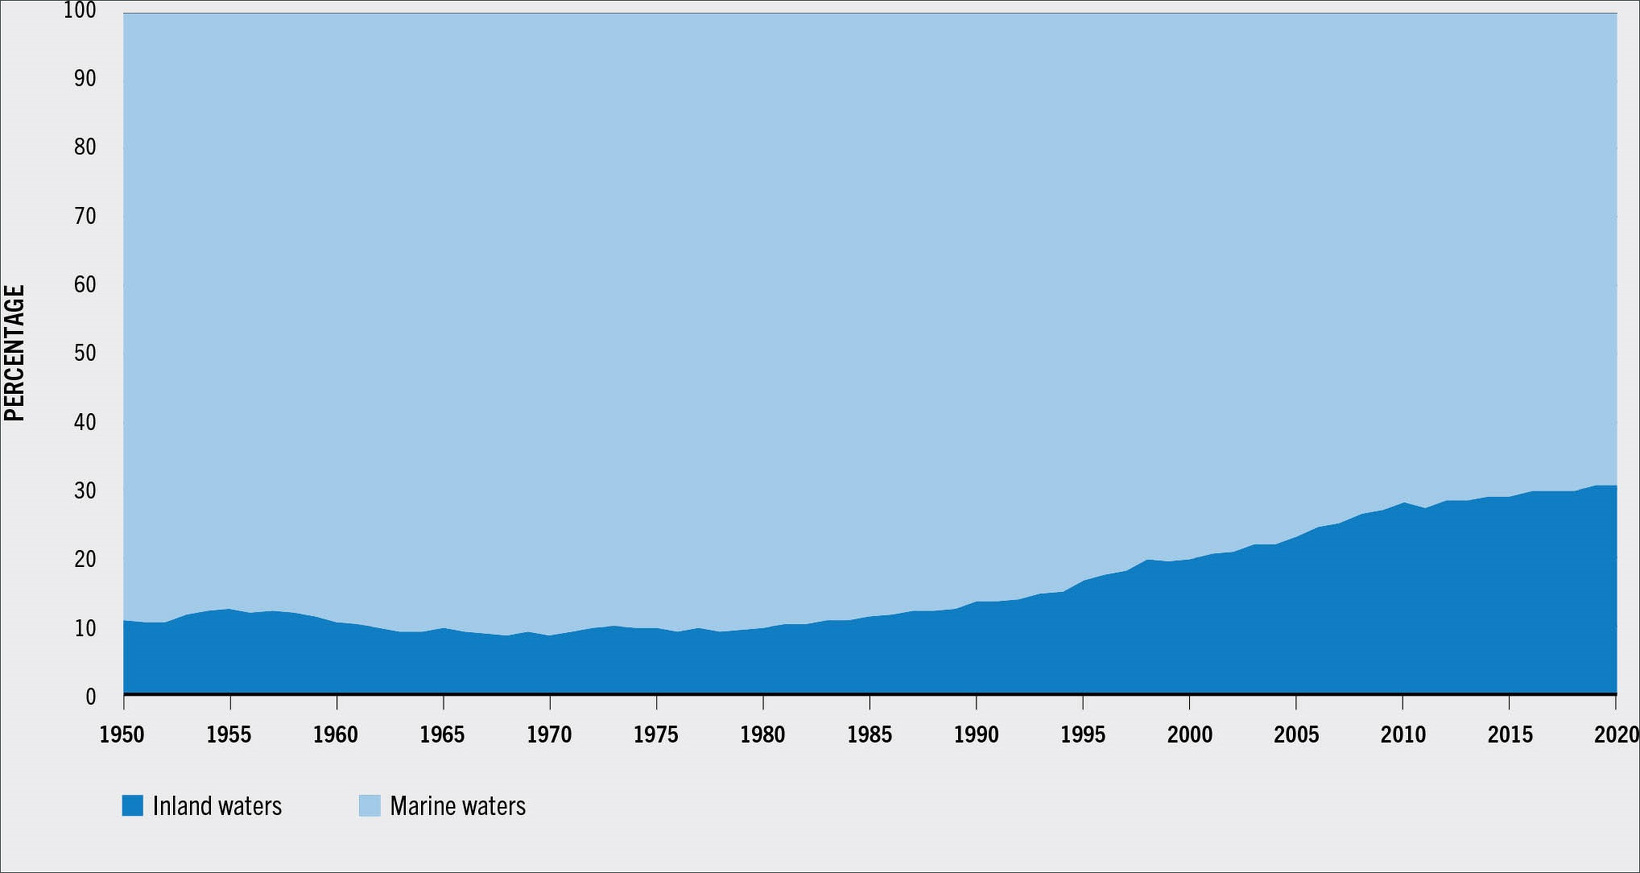
Share of World Total Fisheries and Aquaculture Production by Inland and Marine Waters
In 2020, China continued to be the major producer with a share of 35 percent of the total, followed by India (8 percent), Indonesia (7 percent), Viet Nam (5 percent) and Peru (3 percent). These five countries were responsible for about 58 percent of the world fisheries and aquaculture production of aquatic animals in 2020. Differences exist also in terms of the sector’s contribution to economic development. In recent decades, a growing share of total fisheries and aquaculture production has been harvested by low- and middle-income countries (from about 33 percent in the 1950s to 87 percent in 2020). In 2020, upper-middle-income countries, including China, were the main producers, responsible for 49 percent of the total production of aquatic animals, followed by lower-middle-income countries (32 percent), high-income countries (17 percent) and, finally, low-income countries (2 percent).
Fishing Trends
According to the FAO: Major differences can be noticed when analysing the data by FAO Major Fishing Area. In 2020, about 33 percent of the total production of aquatic animals was produced in inland waters in Asia, followed by 22 percent in the Pacific Northwest and 10 percent in the Western Central Pacific. Overall, in the 1950s, more than 40 percent of production was harvested in the Atlantic Ocean; in contrast, in 2020, the largest share of total production originated in the Pacific Ocean (40 percent) and just 13 percent in the Atlantic Ocean. [Source: “The State of World Fisheries and Aquaculture 2022" by the Food and Agriculture Organization of the United Nations (FAO)]
Production differs from area to area depending on several factors, including the level of development of the countries surrounding those areas, the fisheries and aquaculture management measures implemented, the amount of illegal, unreported and unregulated (IUU) fishing, the status of fishery stocks, the availability and quality of the inland waters, and the composition of the species harvested. For example, for some fishing areas, capture fisheries can fluctuate more when catches comprise a high proportion of small pelagic fish, which are more prone to large fluctuations – linked, in some areas, to climatic variability, as is the case for catches of anchoveta in the Pacific Southeast in South America.
A large number of species are harvested every year, with the number and species varying from region to region. In 2020, finfish represented 76 percent of the total production of aquatic animals, with marine fishes representing 51 percent of the total finfish and 39 percent of the total aquatic animal production, followed by freshwater fishes, representing 43 percent of the total finfish and 33 percent of the total aquatic animal production. Carps, barbels and other cyprinids represented the main group of species produced in 2020, with a share of 18 percent of the production of aquatic animals, followed by miscellaneous freshwater species and Clupeiforms such as herrings, sardines and anchovies. At the level of species, with 5.8 million tonnes, whiteleg shrimp (Penaeus vannamei) was the top species produced in 2020, closely followed by grass carp (white amur; Ctenopharyngodon idellus), cupped oysters nei (Crassostrea spp.), silver carp (Hypophthalmichthys molitrix) and anchoveta (Peruvian anchovy; Engraulis ringens).
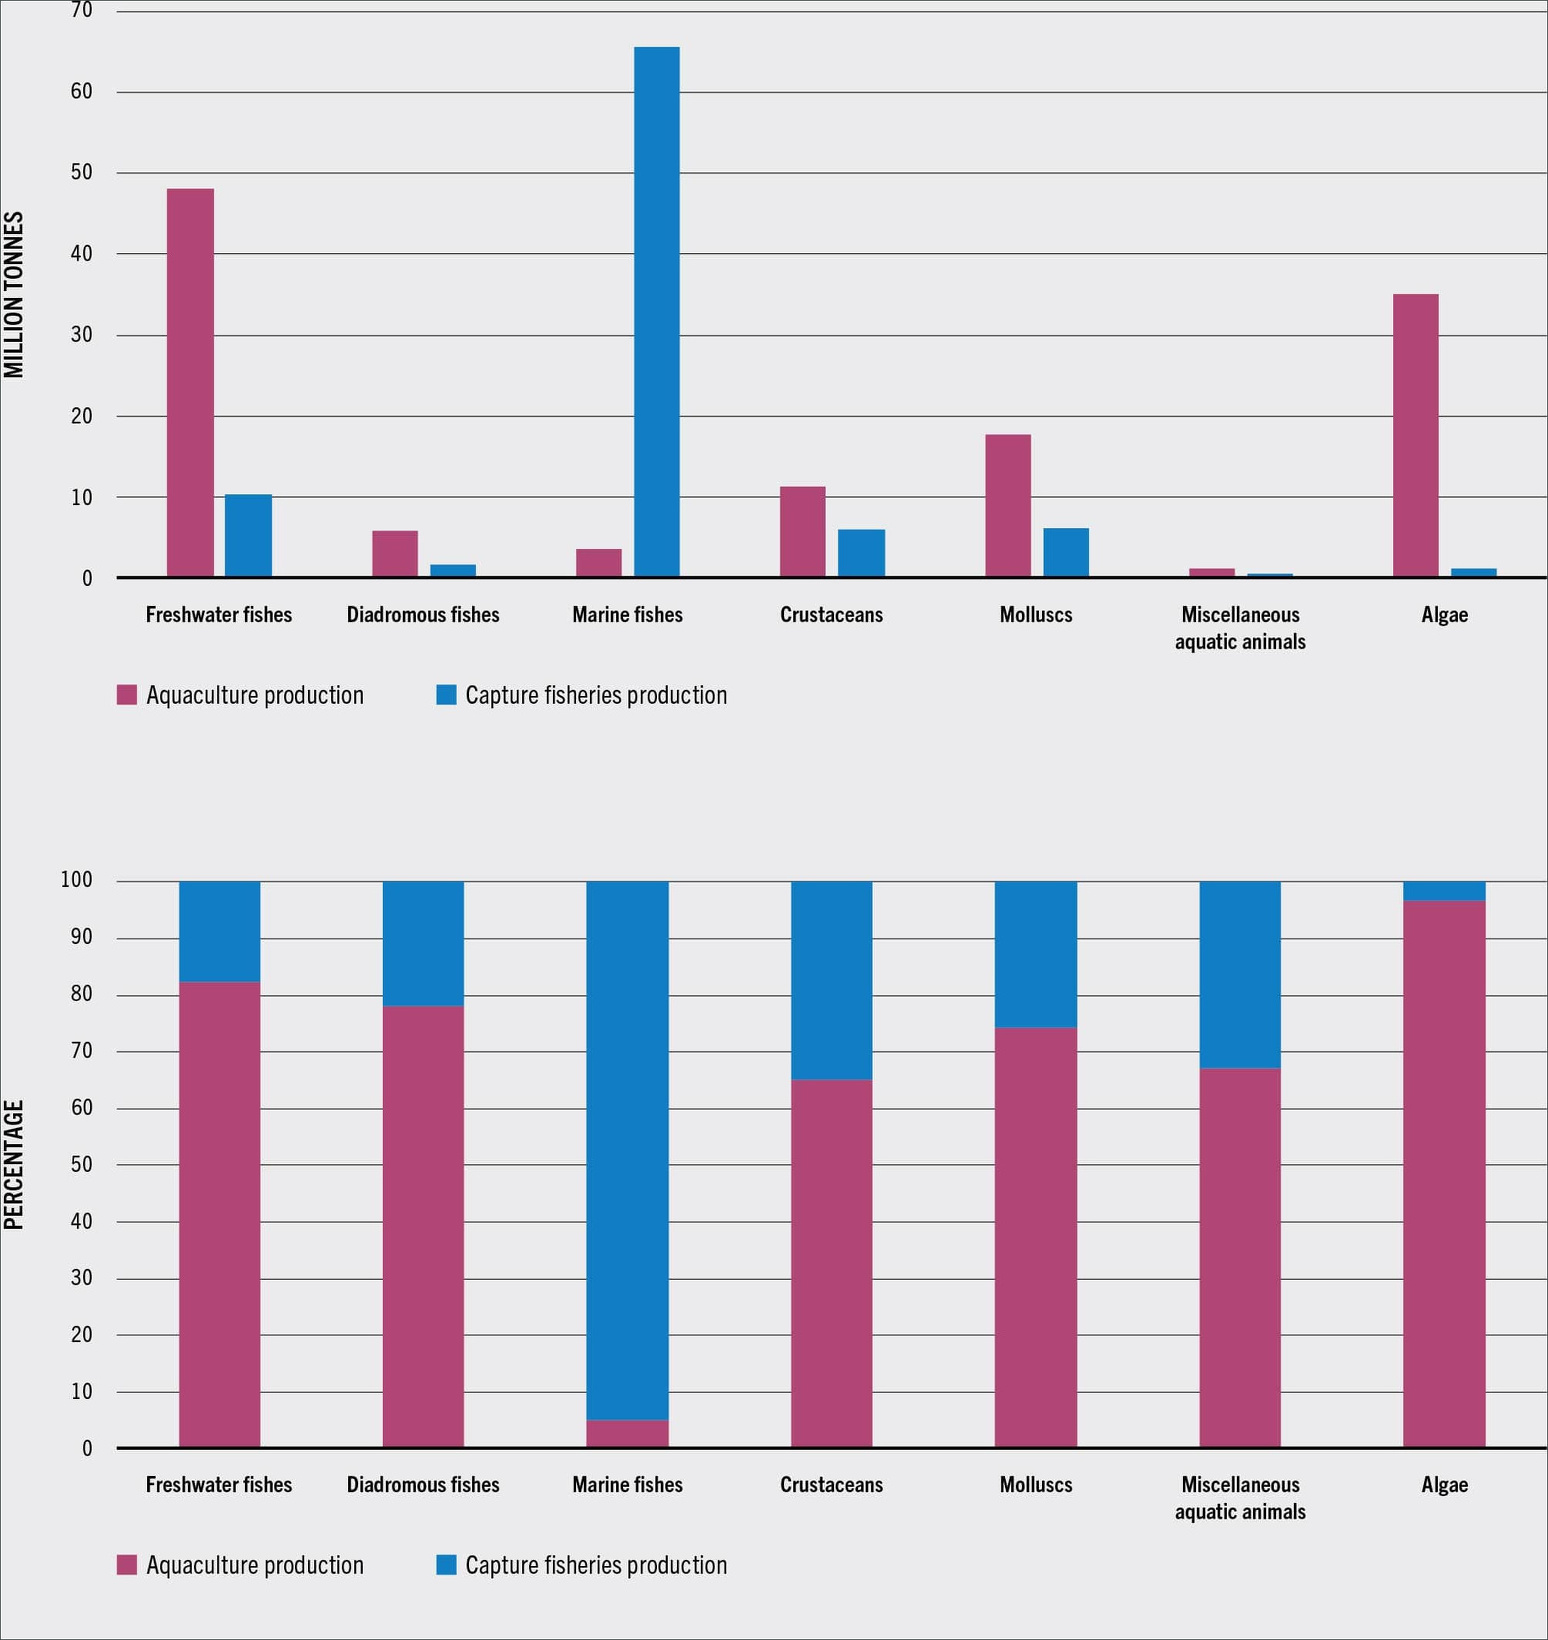
World Capture Fisheries and Aquaculture Production by Isscaap Divisions, in Absolute Values and Percentage, 2020
Harvested Aquatic Animals by Weight
Common name(s) — Scientific name — Wild or Farmed — Harvest in tonnes (1000 kilograms)
1) Grass carp — Ctenopharyngodon idella — Farmed — 6,068,014 tonnes
China is the major producer of the grass carp, which grows quickly and requires fairly little dietary protein. Low-cost feed such as grain processing and vegetable oil extraction by-products, terrestrial grass, and aquatic weeds, allows the grass carp to be produced cheaply. This fish is mainly sold fresh, either in pieces or whole.
2) Peruvian anchoveta — Engraulis ringens — Wild — 4,692,855 tonnes
3) Silver carp — Hypophthalmichthys molitrix — Farmed — 4,189,578 tonnes
A variety of Asian carp, widely cultivated with other aquaculture carp, but under pressure in its home range (China and eastern Siberia). Also called "flying fish", it is an invasive species in many countries.
4) Common carp — Cyprinus carpio — Farmed — 3,791,913 tonnes
5) Asari, Japanese littleneck,Manila clam, Filipino Venus, Japanese cockle, Japanese carpet shell — Venerupis philippinarum — Farmed — 3,785,311 tonnes
6) Alaska pollock — Theragra chalcogramma — Wild — 3,271,426 tonnes
This species is often the main ingredient in the so-called crab sticks.
7) Nile tilapia — Oreochromis niloticus — Farmed — 3,197,330 tonnes
8) Whiteleg shrimp — Penaeus vannamei — Farmed — 3,178,721 tonnes
9) Bighead carp — Hypophthalmichthys nobilis — Farmed — 2,898,816 tonnes
10) Skipjack tuna — Katsuwonus pelamis — Wild — 2,795,339 tonnes
11) Catla — Catla catla — Farmed — 2,761,022 tonnes
12) Crucian carp — Carassius carassius — Farmed — 2,451,845 tonnes
13) Atlantic salmon — Salmo salar — Farmed — 2,066,561 tonnes
The wild Atlantic salmon fishery is commercially dead; after extensive habitat damage and overfishing, wild fish make up only 0.5% of the Atlantic salmon available in world fish markets. The rest are farmed, predominantly from aquaculture in Norway, Chile, Canada, the UK, Ireland, Faroe Islands, Russia and Tasmania in Australia.
14) Atlantic herring — Clupea harengus — Wild — 1,849,969 tonnes
15) Chub mackerel — Scomber japonicus — Wild — 1,581,314 tonnes
16) Rohu — Labeo rohita — Farmed — 1,555,546 tonnes
17) Yellowfin tuna — Thunnus albacares — Wild — 1,352,204 tonnes
18) Japanese anchovy — Engraulis japonicus — Wild — 1,296,383 tonnes
19) Largehead hairtail — Trichiurus lepturus — Wild — 1,235,373 tonnes
20) Atlantic Cod — Gadus morhua — Wild — 1,114,382 tonnes
21) European pilchard — Sardina pilchardus — Wild — 1,019,392 tonnes
22) Capelin — Mallotus villosus — Wild — 1,006,533 tonnes
23) Jumbo flying squid — Dosidicus gigas — Wild — 950,630 tonnes
24) Milkfish — Chanos chanos — Farmed — 943,259 tonnes
25) Atlantic mackerel — Scomber scombrus — Wild — 910,697 tonnes
26) Rainbow trout — Oncorhynchus mykiss — Farmed — 855,982 tonnes
27) Giant tiger prawn, Asian tiger shrimp — Penaeus monodon — Farmed — 855,055 tonnes
28) Araucanian herring — Clupea bentincki — Wild — 848,466 tonnes
29) Chinese razor clam, Agemaki clam — Sinonovacula constricta — Farmed — 720,466 tonnes
30) Chinese mitten crab — Eriocheir sinensis — Farmed — 714,392 tonnes
31) Wuchang bream — Megalobrama amblycephala — Farmed — 705,821 tonnes
32) Pacific oyster, Japanese oyster, Miyagi oyster — Crassostrea gigas — Farmed — 608,688 tonnes
33) Louisiana crawfish, Red swamp crawfish — Procambarus clarkii — Farmed — 598,289 tonnes
34) Akiami paste shrimp — Acetes japonicus — Wild — 588,761 tonnes
One of 14 species in the genus Acetes, this small, krill-like prawn is used to produce shrimp paste in South East Asia.
35) Gulf menhaden — Brevoortia patronus — Wild — 578,693 tonnes
36) Indian oil sardine — Sardinella longiceps — Wild — 560,145 tonnes
37) Black carp — Mylopharyngodon piceus — Farmed — 495,074 tonnes
38) European anchovy — Engraulis encrasicolus — Wild — 489,297 tonnes
39) Northern snakehead — Channa argus — Farmed — 480,854 tonnes
40) Pacific cod — Gadus macrocephalus — Wild — 474,047 tonnes
41) Pacific saury — Cololabis saira — Wild — 460,961 tonnes
42) Pacific herring — Clupea pallasii — Wild — 451,457 tonnes
43) Bigeye tuna — Thunnus obesus — Wild — 450,546 tonnes
44) Chilean jack mackerel — Trachurus murphyi — Wild — 447,060 tonnes
45) Yellow croaker — Larimichthys polyactis — Wild — 437,613 tonnes
46) Haddock — Melanogrammus aeglefinus — Wild — 430,917 tonnes
47) Gazami crab — Portunus trituberculatus — Wild — 429,959 tonnes
48) Amur catfish, Japanese common catfish — Silurus asotus — Farmed — 413,350 tonnes
49) European sprat — Sprattus sprattus — Wild — 408,509 tonnes
50) Pink salmon — Oncorhynchus gorbuscha — Wild — 406,131 tonnes
51) Mrigal carp — Cirrhinus mrigala — Cultivated — 396,476 tonnes
52) Channel catfish — Ictalurus punctatus — Farmed — 394,179 tonnes
53) Blood cockle — Anadara granosa — Farmed — 391,574 tonnes
54) Blue whiting — Micromesistius poutassou — Wild — 378,794 tonnes
55) Hilsa shad — Tenualosa ilisha — Wild — 376,734 tonnes
56) Daggertooth pike conger — Muraenesox cinereus — Wild — 372,704 tonnes
57) California pilchard — Sardinops caeruleus — Wild — 364,386 tonnes
58) Cape horse mackerel — Trachurus capensis — Wild — 356,795 tonnes
59) Pacific anchoveta — Cetengraulis mysticetus — Wild — 352,945 tonnes
60) Japanese flying squid — Todarodes pacificus — Wild — 351,229 tonnes
61) Argentine shortfin squid — Illex argentinus — Wild — 340,622 tonnes
62) Pollock — Pollachius virens — Wild — 336,838 tonnes
63) Chinese softshell turtle — Pelodiscus sinensis Cultivated — 335,535 tonnes
This species is a significant part of China's aquaculture. According to the data obtained from 684 Chinese turtle farms, they sold over 91 million turtles of this species every year; considering that these farms represented less than half of the 1,499 registered turtle farms in China, the nationwide total could be over twice as high.
64) Kawakawa — Euthynnus affinis — Wild — 328,927 tonnes
65) Indian mackerel — Rastrelliger kanagurta — Wild — 325,612 tonnes
66) Asian swamp eel — Monopterus albus — Farmed — 321,006 tonnes
67) Yesso scallop — Patinopecten yessoensis — Wild — 318,081 tonnes
68) Argentine hake — Merluccius hubbsi — Wild — 318,067 tonnes
69) Northern prawn — Pandalus borealis — Wild — 315,511 tonnes
70) Short mackerel — Rastrelliger brachysoma — Wild — 312,930 tonnes
71) Southern rough shrimp — Trachysalambria curvirostris — Wild — 308,257 tonnes
72) Southern African anchovy — Engraulis capensis — — Wild — 307,606 tonnes
73) Pond loach — Misgurnus anguillicaudatus — Farmed — 294,456 tonnes
74) Iridescent shark — Pangasius hypophthalmus — Farmed — 285,089 tonnes
75) Mandarin fish, Chinese perch — Siniperca chuatsi — Farmed — 281,502 tonnes
76) Nile perch — Lates niloticus — Wild — 278,675 tonnes
77) Round sardinella — Sardinella aurita — Wild — 273,018 tonnes
78) Japanese pilchard — Sardinops melanostictus — Wild — 269,972 tonnes
79) American sea scallop — Placopecten magellanicus — Wild — 267,745 tonnes
80) Bombay-duck — Harpadon nehereus — Wild — 257,376 tonnes
81) Yellowhead catfish, Korean bullhead — Tachysurus fulvidraco — Farmed — 256,650 tonnes
82 ) Narrow-barred Spanish mackerel — Scomberomorus commerson — Wild — 256,469 tonnes
83) Albacore — Thunnus alalunga — Wild — 256,082 tonnes
84) Madeiran sardinella — Sardinella maderensis — Wild — 251,342 tonnes
85) Bonga shad — Ethmalosa fimbriata — Wild — 249,422 tonnes
86) Silver cyprinid — Rastrineobola argentea — Wild — 241,122 tonnes
87) Nile tilapia — Oreochromis niloticus — Wild — 235,003 tonnes
88) Longtail tuna — Thunnus tonggol — Wild — 234,427 tonnes
89) Atlantic menhaden — Brevoortia tyrannus — Wild — 224,404 tonnes
90) Giant tiger prawn — Penaeus monodon — Wild — 212,504 tonnes
91) North Pacific hake — Merluccius productus — Wild — 206,985 tonnes
92) Atlantic horse mackerel — Trachurus trachurus — Wild — 205,807 tonnes
93) Japanese jack mackerel — Trachurus japonicus — Wild — 202,816 tonnes
94) Pacific thread herring — Opisthonema libertate — Wild — 201,993 tonnes
One of five species in the genus Opisthonema tonnes
95) Bigeye scad — Selar crumenophthalmus — Wild — 200,617 tonnes
96) Yellowstripe scad — Selaroides leptolepis — Wild — 198,600 tonnes
97) Chum salmon — Oncorhynchus keta — Wild — 189,777 tonnes
98) Antarctic krill — Euphausia superba — Wild — 188,147 tonnes
99) Blue swimming crab — Portunus pelagicus — Wild — 180,119 tonnes
100) Pacific sand lance, Pacific sandlance — Ammodytes personatus — Wild — 175,892 tonnes
Mostly manufactured into oil and meal, but also used as food in Japan.
101) Goldstripe sardinella — Sardinella gibbosa — Wild — 161,839 tonnes
[Source: Food and Agriculture Organization of the United Nations (FAO), 2012; Wikipedia]
Image Sources: Wikimedia Commons, National Oceanic and Atmospheric Administration (NOAA); Ray Kinnane, JNTO, FAO
Text Sources: New York Times, Washington Post, Los Angeles Times, Times of London, Yomiuri Shimbun, The Guardian, National Geographic, The New Yorker, Time, Newsweek, Reuters, AP, Lonely Planet Guides, Compton’s Encyclopedia and various books and other publications.
Last updated April 2023